. 2008 Oct 8:8:172.
doi: 10.1186/1471-2180-8-172.

Global transcriptional response to mammalian temperature provides new insight into Francisella tularensis pathogenesis

Affiliations

Global transcriptional response to mammalian temperature provides new insight into Francisella tularensis pathogenesis

Joseph Horzempa et al. BMC Microbiol. .

Abstract

Background: After infecting a mammalian host, the facultative intracellular bacterium, Francisella tularensis, encounters an elevated environmental temperature. We hypothesized that this temperature change may regulate genes essential for infection.

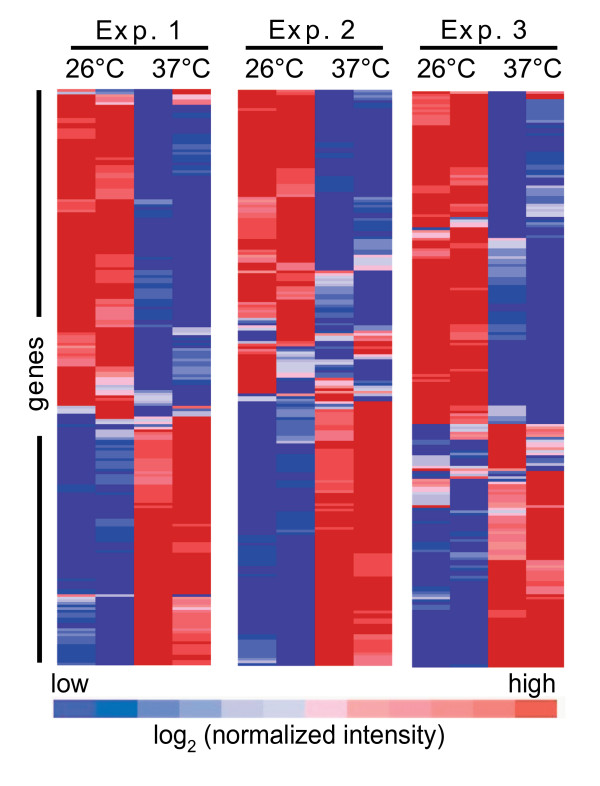
Results: Microarray analysis of F. tularensis LVS shifted from 26 degrees C (environmental) to 37 degrees C (mammalian) showed approximately 11% of this bacterium's genes were differentially-regulated. Importantly, 40% of the protein-coding genes that were induced at 37 degrees C have been previously implicated in virulence or intracellular growth of Francisella in other studies, associating the bacterial response to this temperature shift with pathogenesis. Forty-four percent of the genes induced at 37 degrees C encode proteins of unknown function, suggesting novel Francisella virulence traits are regulated by mammalian temperature. To explore this possibility, we generated two mutants of loci induced at 37 degrees C [FTL_1581 and FTL_1664 (deoB)]. The FTL_1581 mutant was attenuated in a chicken embryo infection model, which was likely attributable to a defect in survival within macrophages. FTL_1581 encodes a novel hypothetical protein that we suggest naming temperature-induced, virulence-associated locus A, tivA. Interestingly, the deoB mutant showed diminished entry into mammalian cells compared to wild-type LVS, including primary human macrophages and dendritic cells, the macrophage-like RAW 264.7 line, and non-phagocytic HEK-293 cells. This is the first study identifying a Francisella gene that contributes to uptake into both phagocytic and non-phagocytic host cells.

Conclusion: Our results provide new insight into mechanisms of Francisella virulence regulation and pathogenesis. F. tularensis LVS undergoes considerable gene expression changes in response to mammalian body temperature. This temperature shift is important for the regulation of genes that are critical for the pathogenesis of Francisella. Importantly, the compilation of temperature-regulated genes also defines a rich collection of novel candidate virulence determinants, including tivA (FTL_1581). An analysis of tivA and deoB (FTL_1664) revealed that these genes contribute to intracellular survival and entry into mammalian cells, respectively.


Figures

Figure 1
Figure 1
Global Francisella gene expression changes induced by mammalian body temperature. Genes that were identified as statistically significant by J5 scores across three independent microarray experiments were subjected to hierarchical clustering. Fluorescence intensities were standardized by the minimum mean ratio array normalization followed by log2 transformation. Values were clustered using the Pearson correlation in GenePattern by independently inputting individual data from each experiment. Oligonucleotides testing individual LVS ORFs are in duplicate on each array and the results are displayed as two columns per experiment in GenePattern. The 95 induced genes and 125 repressed genes clustered together in this GenePattern output, validating the J5 statistical analysis from GEDA. (B).
Figure 2
Figure 2
Validation of the microarray results and comparison with Q-PCR. (A) RNA from the microarray experiments depicted in panel A were tested for up- or down-regulation of specific genes using Q-PCR. Q-PCR data are represented with solid bars, whereas values from microarray experiments are depicted as striped bars. Both data sets are presented as mean ± SEM from three individual experiments. (B) Correlation analysis of the microarray and Q-PCR transcript measurements for nine select F. tularensis LVS ORFs. The microarray log2 values were plotted against the Q-PCR log2 data. The correlation coefficient (R2) between the two analyses is 0.94.
Figure 3
Figure 3
COG analysis of genes up- or down-regulated by mammalian temperature. COG categories were identified for each significantly up- or down-regulated gene based on the genomic annotation (accession, NC_07880). Specific COG categories were consolidated into general categories as follows: J, K, L, and RNA genes were combined into "Transcription/translation/DNA replication/RNA"; P, C, G, E, F, H, I, and Q were merged into "Transport and metabolism"; categories N and U were combined into "Cellular functions/trafficking/secretion"; and categories R, S, and uncategorized genes were classified as "Unknown". All other COG categories were reported as they were originally assigned.
Figure 4
Figure 4
FTL_1581 contributes to F. tularensis LVS virulence. (A) A schematic of FTL_1581 protein is depicted showing domains predicted by PROSITE. (B) Competition studies in the chicken embryo infection model using a mixture of LVS and 1581d (1:1 based on OD600; viable bacteria in the inoculum were quantified by diluting and plating the input). Competition ratios (1581d: LVS) were normalized to the input to account for differences in the inoculum. These ratios were analyzed for statistical significance by Chi square; P < 0.001 at days 1, 2, and 3 post-infection. Data are mean competition ratio ± SEM of three embryos per time point within one experiment and are representative of duplicate experiments. (C) Macrophages were infected with LVS, 1581d, or 1581d/pFTL_1581 and were lysed at the indicated times. Data are mean ± SEM of triplicate wells within one experiment and are representative of four experiments performed using cells from separate donors. Following log transformation, differences in CFU were determined by a Student's t-Test in which P = 0.003 at 24 h.
Figure 5
Figure 5
deoB is important for entry of F. tularensis LVS. (A) Primary human macrophages (MΦs) or dendritic cells (DCs) were infected with either LVS, 1664d, or 1664d/pFTL_1664 in microtitre plates. After a two-hour incubation, wells were treated with gentamicin to kill extracellular bacteria, followed by vigorous washing. Subsequently, phagocytic cells were lysed and serial dilutions of lysates were plated for CFU enumeration. Data are mean ± SEM of triplicate wells within one experiment and are representative of four (primary human macrophages) or two experiments (dendritic cells) performed using cells from separate donors. Following log transformation, differences in CFU between LVS and 1664d were determined by a Student's t-Test in which P = 0.00005 and 0.003 for MΦs and DCs, respectively. (B) Bacteria were stained with the fluorescent green stain, Syto-9 prior to infection. After a two-hour incubation with RAW 264.7 cells, extracellular bacteria were washed away and cells were analyzed under brightfield (BF) and fluorescence (Fluor.) microscopy. The exposure time was extended to enhance sensitivity of detecting the low numbers of 1664d within the RAW 264.7 cells, leading to some background fluorescence. Fluorescence images were initially captured in grayscale and pseudocolored using Adobe Photoshop. Data displayed are representative of duplicate experiments. Scale bar = 50 μm. (C) Human embryonic kidney 293 (HEK-293) cells were infected similarly to the phagocytic cells in panel A. Data are mean ± SEM of triplicate wells within one experiment and are representative of three experiments. Following log transformation, differences in CFU between LVS and 1664d were determined by a Student's t-Test in which P = 0.0004.

References

    1. Ellis J, Oyston PC, Green M, Titball RW. Tularemia. Clin Microbiol Rev. 2002;15:631–646. doi: 10.1128/CMR.15.4.631-646.2002. - DOI - PMC - PubMed
    1. Sjostedt A. Tularemia: history, epidemiology, pathogen physiology, and clinical manifestations. Ann N Y Acad Sci. 2007;1105:1–29. doi: 10.1196/annals.1409.009. - DOI - PubMed
    1. Dennis DT, Inglesby TV, Henderson DA, Bartlett JG, Ascher MS, Eitzen E, Fine AD, Friedlander AM, Hauer J, Layton M, et al. Tularemia as a biological weapon: medical and public health management. Jama. 2001;285:2763–2773. doi: 10.1001/jama.285.21.2763. - DOI - PubMed
    1. Berdal BP, Mehl R, Meidell NK, Lorentzen-Styr AM, Scheel O. Field investigations of tularemia in Norway. FEMS Immunol Med Microbiol. 1996;13:191–195. doi: 10.1111/j.1574-695X.1996.tb00235.x. - DOI - PubMed
    1. Oyston PC, Quarry JE. Tularemia vaccine: past, present and future. Antonie Van Leeuwenhoek. 2005;87:277–281. doi: 10.1007/s10482-004-6251-7. - DOI - PubMed

Publication types

MeSH terms

LinkOut - more resources