. 2008 Nov 28;283(48):33784-92.
doi: 10.1074/jbc.M802431200. Epub 2008 Oct 8.

Rheb and mTOR regulate neuronal polarity through Rap1B

Affiliations

Rheb and mTOR regulate neuronal polarity through Rap1B

Ying-Hua Li et al. J Biol Chem. .

Abstract

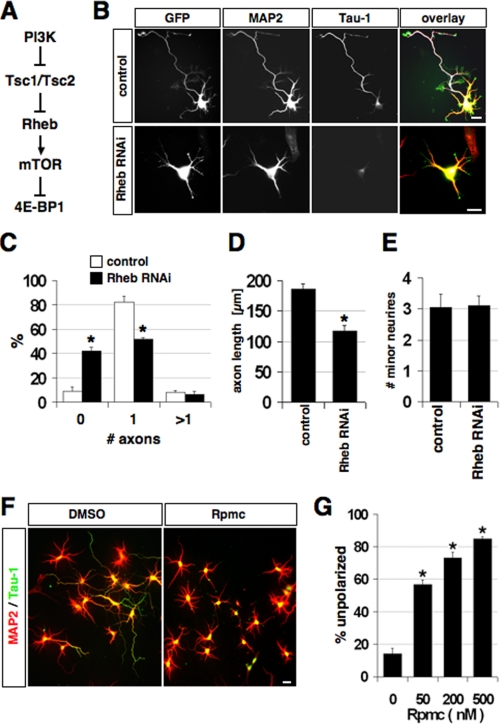
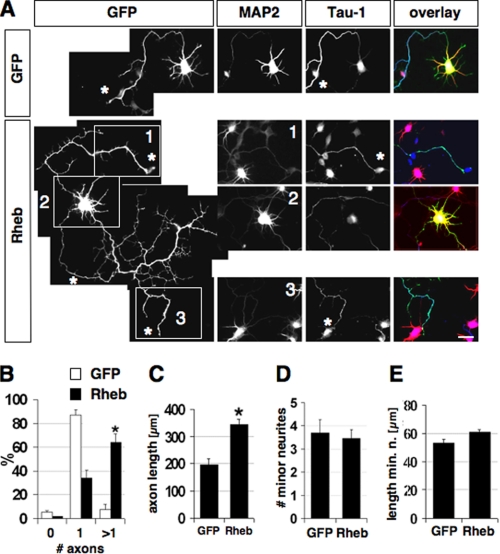
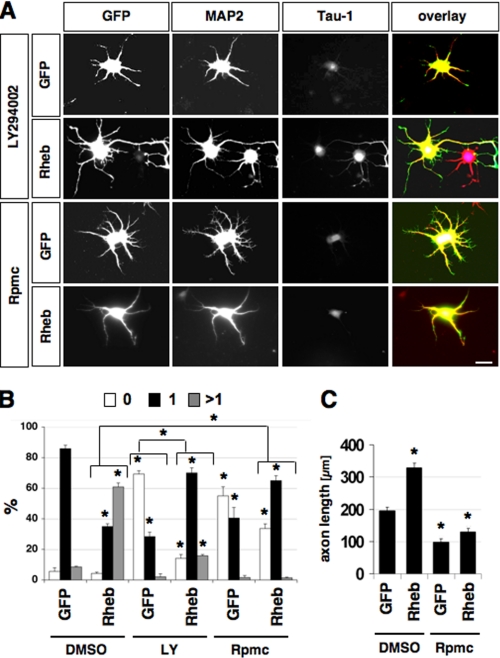
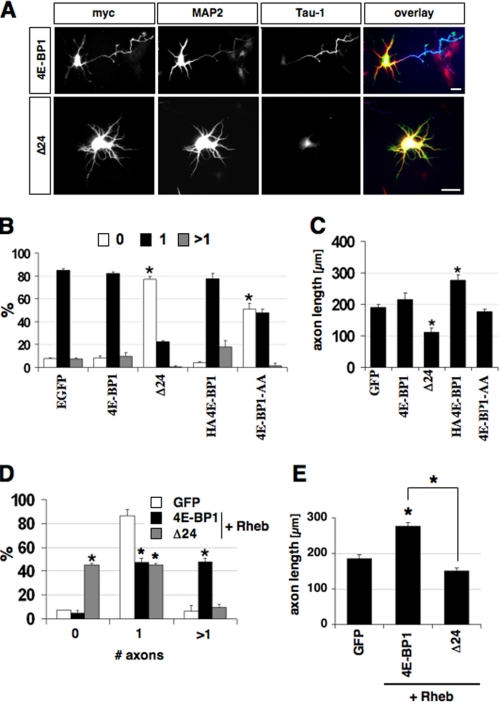
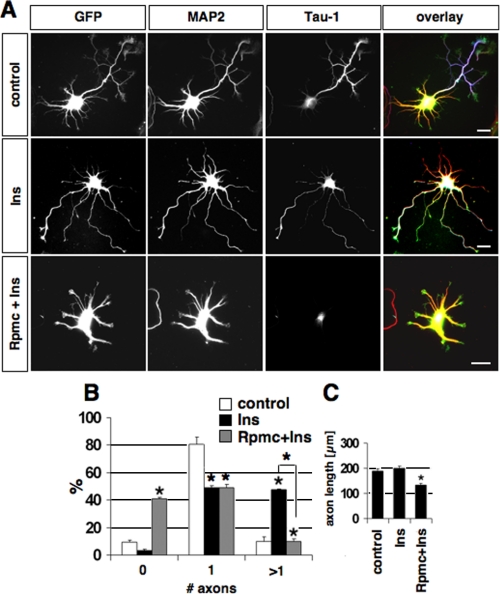
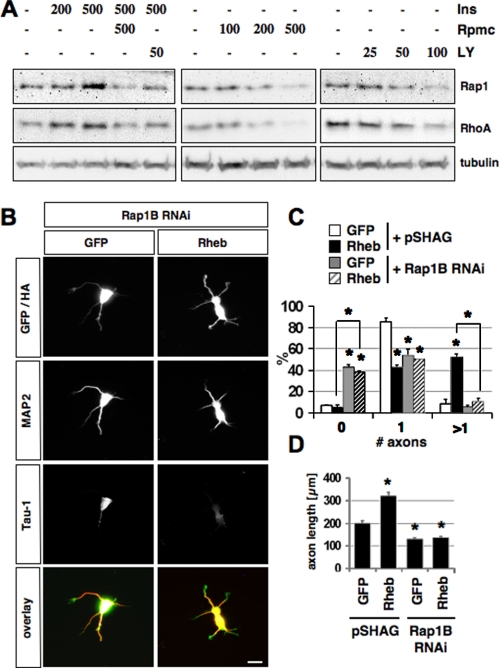
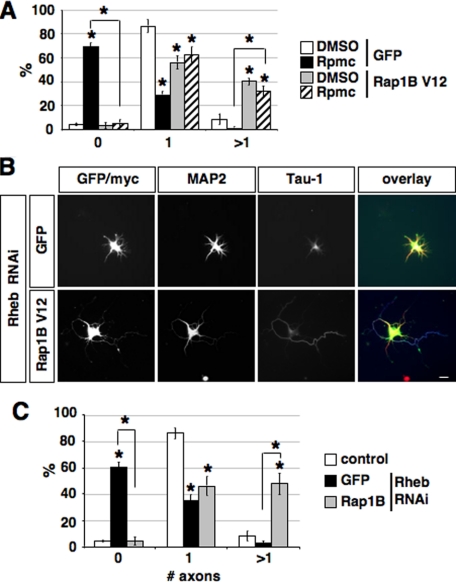
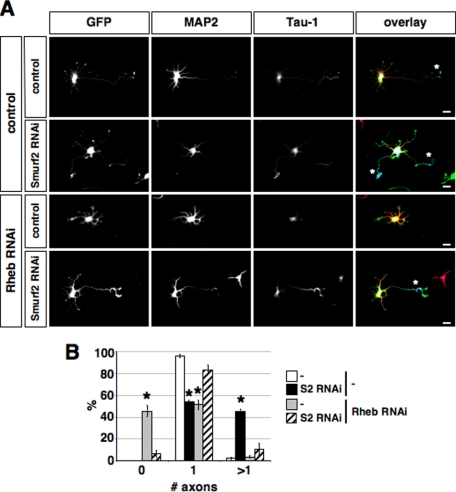
The development of polarized hippocampal neurons with a single axon and multiple dendrites depends on the activity of phosphoinositide 3-kinase (PI3K) and the GTPase Rap1B. Here we show that PI3K regulates axon specification and elongation through the GTPase Rheb and its target mammalian target of rapamycin (mTOR). Overexpression of Rheb induces the formation of multiple axons, whereas its suppression by RNA interference blocks axon specification. mTOR is a central regulator of translation that phosphorylates eIF4E-binding proteins like 4E-BP1. Axon formation was suppressed by inhibition of mTOR and expression of mTOR-insensitive 4E-BP1 mutants. Inhibition of PI3K or mTOR reduced the level of Rap1B, which acts downstream of Rheb and mTOR. The ubiquitin E3 ligase Smurf2 mediates the restriction of Rap1B by initiating its degradation. Suppression of Smruf2 by RNA interference is able to compensate the loss of Rheb. These results indicate that the mTOR pathway is required to counteract the Smurf2-initiated degradation of Rap1B during the establishment of neuronal polarity.


Figures

FIGURE 1.
FIGURE 1.
Rheb and mTOR activity are required for neuronal polarity. A, an overview of the PI3K/Rheb/mTOR pathway is shown. PI3K promotes translation by inhibiting the Tsc1·Tsc2 complex that acts as a GTPase activating protein for Rheb (17). B, neurons were transfected on 0 d.i.v. with vectors for EGFP and pSuper (control) or pSb102 (shRNA vector directed against Rheb), and stained on 3 d.i.v. with the Tau-1 (blue) and anti-MAP2 (red) antibodies. C-E, the percentage of neurons without an axon, with a single axon, and with multiple axons (C), the length of axon (D), and the number of minor neurites per neuron (E) is shown (mean ± S.E.; *, p < 0.001 compared with pSuper; n > 100). F, solvent (DMSO) or 200 nm rapamycin (Rpmc) were added to neurons 3-5 h after plating. Neurons were stained at 3 d.i.v. with the Tau-1 (green, axonal marker) and anti-MAP2 antibodies (red, minor neurites). Axons were identified as processes showing Tau-1 immunoreactivity in their distal segments. MAP2-positive neurites longer than one cell diameter were classified as dendrites (mean ± S.E., three independent experiments; *, p < 0.001 compared with control (DMSO); n > 150). G, quantification of polarity defects caused at 3 d.i.v. by rapamycin at different concentrations (n = 200-250 neurons per condition). Neurons, which did not extend any axon, were classified as unpolarized. The scale bar is 20 μm.
FIGURE 2.
FIGURE 2.
Rheb expression induces multiple axons. A, neurons were transfected on 0 d.i.v. with plasmids for EGFP or EGFP and Rheb (green) and stained on 3 d.i.v. with the Tau-1 (blue) and anti-MAP2 (red) antibodies. Tau-1-positive axons are marked by asterisks. The cell body (2) and two of the axons (1 and 3) are shown for a representative neuron with multiple axons. B-E, the percentage of neurons without an axon (0), with a single axon (1), and with multiple axons (>1) (B), the length of axons (C), the number of minor neurites (D), and the length of minor neurites (E) after expression of EGFP or Rheb is shown (mean ± S.E.; *, p < 0.001 (B and D) or <0.005 (C) compared with EGFP; n > 90). The scale bar is 20 μm.
FIGURE 3.
FIGURE 3.
Rheb acts downstream of PI3K and upstream of mTOR. A, neurons were transfected on 0 d.i.v. with plasmids for EGFP or EGFP and Rheb (green), cultured in the presence of DMSO, 100 μm LY294002 (LY), or 200 nm rapamycin (Rpmc) and stained on 3 d.i.v. with the Tau-1 (blue) and anti-MAP2 (red) antibodies. B and C, the percentage of neurons without an axon (0), with a single axon (1), and with multiple axons (>1) (B) and the length of axons (C) are shown (mean ± S.E.; *, p < 0.001 compared with EGFP or between the values indicated by brackets; n > 70). The scale bar is 20 μm.
FIGURE 4.
FIGURE 4.
Expression of mTOR-insensitive 4E-BP1 mutants blocks axon formation and the effects of Rheb. A, neurons were transfected with vectors for 4E-BP1myc (4E-BP1), Δ24-4E-BP1myc (Δ24), HA4E-BP1, or HA4E-BP1-AA at 0 d.i.v., fixed at 3 d.i.v., and stained with antibodies specific for the myc-tag (green), MAP2 (red), or the Tau-1 antibody (blue). B and C, the percentage of neurons without an axon (0), with a single axon (1), and with multiple axons (>1) (B), and the length of axons (C) are shown (mean ± S.E.; *, p < 0.001 (B) or <0.005 (C) compared with GFP; n > 100). D and E, neurons were transfected with vectors for 4E-BP1myc (4E-BP1) or Δ24-4E-BP1myc (Δ24) on 0 d.i.v., fixed on 3 d.i.v., and stained with antibodies specific for the myc tag, MAP2, or the Tau-1 antibody. The percentage of neurons without an axon (0), with a single axon (1), and with multiple axons (>1) (D), and the length of axons (E) are shown (mean ± S.E.; *, p < 0.001 (B) or <0.005 (C) compared with 4E-BP1; n > 80). The scale bar is 20 μm.
FIGURE 5.
FIGURE 5.
Insulin induces the formation of multiple axons in a rapamycin-sensitive manner. A, neurons were transfected with a vector for EGFP to visualize their morphology and treated 4 h after plating with 200 nm insulin (Ins), 200 nm Ins, and 200 nm rapamycin (Rpmc, added 20 min before insulin application), or vehicle and stained on 3 d.i.v. with the Tau-1 (blue) and anti-MAP2 (red) antibodies. B and C, the percentage of neurons without an axon (0), with a single axon (1), and with multiple axons (>1) (B) and the length of axons (C) are shown (mean ± S.E.; *, p < 0.001 compared with control or between the values indicated by brackets; n > 100). The scale bar is 20 μm.
FIGURE 6.
FIGURE 6.
The effect of the PI3K/mTOR pathway depends on Rap1B. A, polarized neurons were incubated with the indicated concentrations of insulin (Ins, nm), rapamycin (nm, Rpmc), or LY294002 (μm, LY) for 10 h before the expression of Rap1B and RhoA was analyzed at 2.5 d.i.v. by Western blot. The loading of comparable amounts of protein was confirmed by staining with an anti-tubulin antibody. B, neurons were transfected on 0 d.i.v. with a vector for EGFP or HA-tagged Rheb (green) and the pSHAG RNAi vector (control) or an shRNA vector directed against Rap1B, and stained on 3 d.i.v. with the Tau-1 (blue) and anti-MAP2 (red) antibodies. C and D, the percentage of neurons without an axon (0), with a single axon (1), and with multiple axons (>1) (C) and the length of axons (D) are shown (mean±S.E.; *, p < 0.001 compared with control or between the values indicated by brackets; n > 100). The scale bar is 20 μm.
FIGURE 7.
FIGURE 7.
Rap1B acts downstream of mTOR and Rheb. A, neurons were transfected on 0 d.i.v. with a vector for EGFP or myc-tagged Rap1BV12, treated with solvent (DMSO) or rapamycin (Rpmc) after transfection, and stained on 3 d.i.v. with the Tau-1 and an anti-MAP2 antibody. The percentage of neurons without an axon (0), with a single axon (1), and with multiple axons (>1) (B) is shown (mean ± S.E.; *, p < 0.001 compared with solvent (DMSO) or between the values indicated by brackets; n > 100). B, neurons were transfected on 0 d.i.v. with a vector for EGFP (control) or myc-tagged Rap1BV12 (green) and the pSHAG RNAi vector (control) or an shRNA vector directed against Rheb (Rheb RNAi) as indicated, and stained on 3 d.i.v. with the Tau-1 (blue) and an anti-MAP2 antibody (red). C, the percentage of neurons without an axon (0), with a single axon (1), and with multiple axons (>1) is shown (mean ± S.E.; *, p < 0.001 compared with control or between the values indicated by brackets; n > 100). The scale bar is 20 μm.
FIGURE 8.
FIGURE 8.
Suppression of Smurf2 rescues the loss of Rheb. A and B, neurons were transfected on 0 d.i.v. with a vector for EGFP (green) and shRNAs directed against Rheb (Rheb RNAi, RB), Smurf2 (Smurf2 RNAi, S2) as indicated. As controls, vectors for shRNAs containing mismatches to the target sequence that do not suppress Rheb (Rheb RNAi mut, control in A and B) or Smurf2 (Smurf2 RNAi mut, control in A and in B) were used. Neurons were stained on 3 d.i.v. with the Tau-1 (blue) and an anti-MAP2 antibody (red). Axons are marked by asterisks. B, the percentage of neurons without an axon (0), with a single axon (1), and with multiple axons (>1) is shown (mean ± S.E.; *, p < 0.001 compared with control (Rheb RNAi mut + Smurf2 RNAi mut)).

Similar articles

Cited by

References

    1. Arimura, N., and Kaibuchi, K. (2007) Nat. Rev. Neurosci. 8 194-205 - PubMed
    1. Da Silva, J. S., and Dotti, C. G. (2002) Nat. Rev. Neurosci. 3 694-704 - PubMed
    1. Dotti, C. G., Sullivan, C. A., and Banker, G. A. (1988) J. Neurosci. 8 1454-1468 - PMC - PubMed
    1. Nakahira, E., and Yuasa, S. (2005) J. Comp. Neurol. 483 329-340 - PubMed
    1. Noctor, S. C., Martinez-Cerdeno, V., Ivic, L., and Kriegstein, A. R. (2004) Nat. Neurosci. 7 136-144 - PubMed

Publication types

MeSH terms

Substances

LinkOut - more resources