. 2009 Jan;328(1):69-82.
doi: 10.1124/jpet.108.146068. Epub 2008 Oct 8.

A single in vivo application of cholinesterase inhibitors has neuron type-specific effects on nicotinic receptor activity in guinea pig hippocampus

Affiliations

A single in vivo application of cholinesterase inhibitors has neuron type-specific effects on nicotinic receptor activity in guinea pig hippocampus

Manickavasagom Alkondon et al. J Pharmacol Exp Ther. 2009 Jan.

Abstract

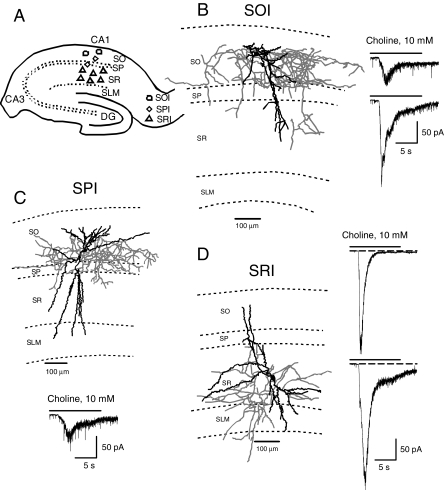
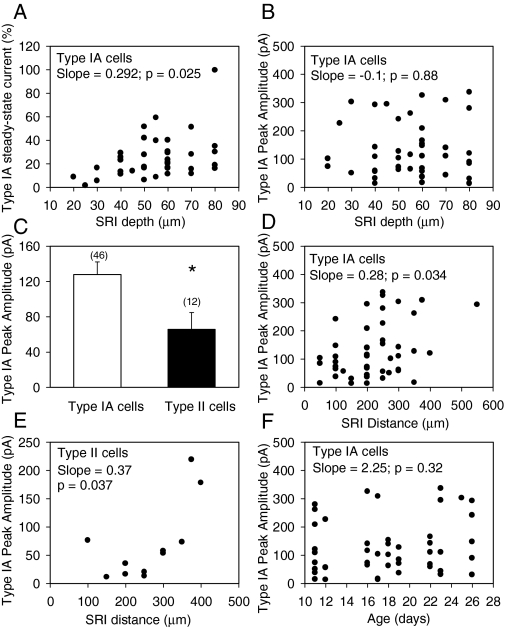
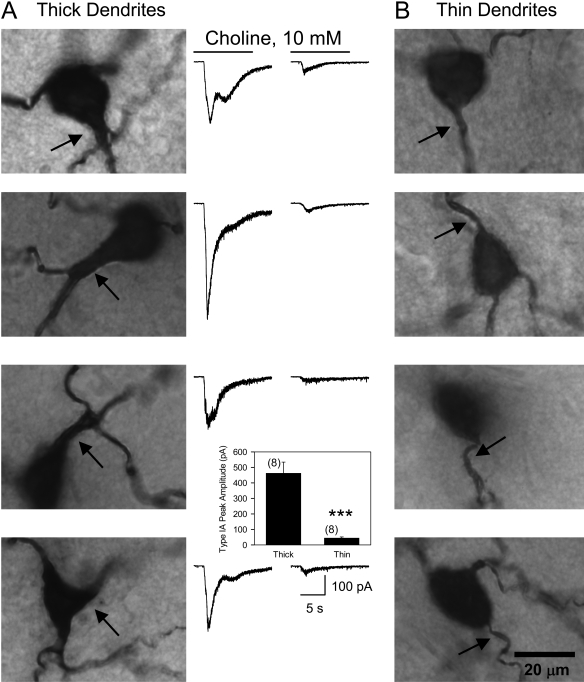
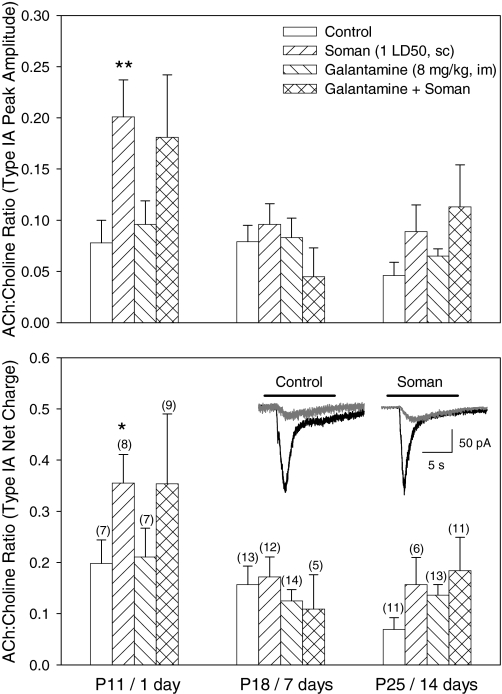
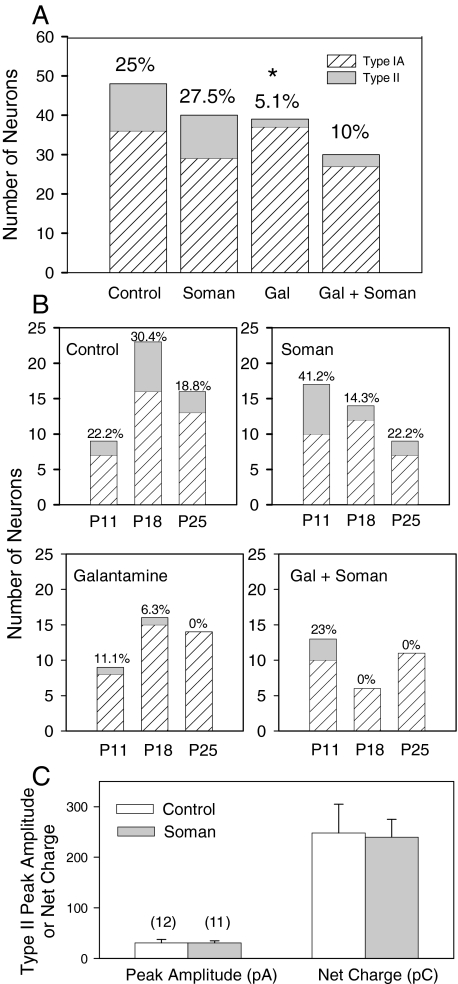
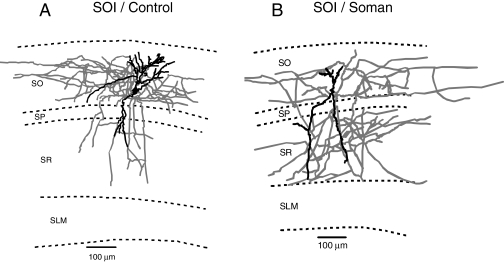
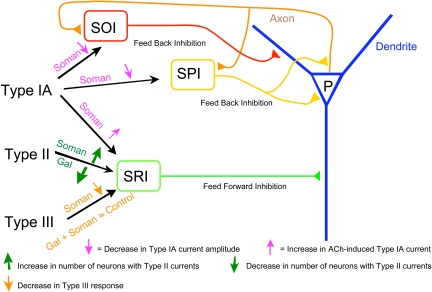
The present study was designed to test the hypothesis that an acute in vivo treatment with reversible or irreversible acetylcholinesterase (AChE) inhibitors modifies the activities of nicotinic receptors (nAChRs) in hippocampal neurons. Here, whole-cell nicotinic responses were recorded from CA1 interneurons in hippocampal slices obtained from male guinea pigs at 1, 7, or 14 days after treatment with the irreversible AChE inhibitor, soman (1x LD(50) s.c.), and/or the reversible AChE inhibitor, galantamine (8 mg/kg i.m.). Naive animals were used as controls. Three types of nAChR responses, namely types IA, II, and III, which were mediated by alpha 7, alpha 4 beta 2, and alpha 3 beta 2 beta 4 nAChRs, respectively, could be recorded from the interneurons. The magnitude of alpha 7 nAChR currents was neuron-type dependent. Stratum radiatum interneurons (SRIs) with thick initial dendrites had the largest alpha 7 nAChR currents. Acute challenge with soman caused sustained reduction of type IA current amplitudes recorded from stratum oriens interneurons and increased the ratio of acetylcholine- to choline-evoked current amplitudes recorded from SRIs. In guinea pigs that developed long-lasting convulsions after the soman challenge, there was a sustained reduction of alpha 3 beta 2 beta 4 nAChR responses. Acute treatment with galantamine had no effect on type IA or III responses, whereas it decreased the incidence of type II currents. Pretreatment of the guinea pigs with galantamine prevented the suppressive effect of soman on type III responses. The neuron type-specific changes in nAChR activity induced by soman, some of which could be prevented by galantamine, may contribute to the maintenance of pathological rhythms in the hippocampal neuronal network.


Figures

Fig. 1.
Fig. 1.
Type IA currents in various interneurons in the CA1 region of guinea pig hippocampal slices. A, scheme of a hippocampal slice illustrating the approximate location of various interneuron types studied in the CA1 region. B, Neurolucida drawing of a biocytin-filled SOI showing that the axon is primarily projecting in the SO region. Sample recording of type IA current recorded from two SOIs are shown on the right. C, Neurolucida drawing of a biocytin-filled SPI showing that the axon is primarily projecting in the pyramidal cell layer. Sample recording of type IA current recorded from SPIs is shown at the bottom. D, Neurolucida drawing of a biocytin-filled SRI showing that the axon is targeted primarily to the SR region. Sample recording of type IA currents recorded from SRIs either decayed completely during agonist pulse (top trace) or had some steady-state current at the end of the agonist pulse (bottom trace). Dendrites are shown in black and axons in gray in all Neurolucida drawings.
Fig. 2.
Fig. 2.
Pharmacological characterization of type IA currents in CA1 interneurons. A to E, sample traces illustrate whole-cell inward currents evoked by the U-tube application of either choline or ACh to interneurons at -60 mV. Traces in A to D represent responses from four SRIs under control conditions, 10 min after bath application of the antagonist and after wash at different times indicated. D, fourth trace (*) was taken at +40 mV and revealed ACh-induced NMDA EPSCs, showing that the whole-cell patch was still viable. Solid line at top of traces indicates the duration of U-tube pulse, and dashed lines indicate the baseline current level. F, sample traces illustrate the fast current transients that represent action potentials induced by U-tube application of choline to an SRI in cell-attached configuration. Bottom trace indicates the absence of fast current transients at 10 min after exposure of the slice to 3 nM MLA. G, bar graph indicates the percentage reduction of type IA current peak amplitude by the antagonists. Type IA currents were evoked by 1 mM ACh (n = 9) or 10 mM choline (n = 13). Graph and error bars represent the mean and S.E.M. of results obtained from three to five neurons, respectively. Numbers in parentheses indicate the number of neurons studied in each group.
Fig. 3.
Fig. 3.
Voltage dependence and agonist sensitivity of type IA currents in SRIs. A, left, sample recordings represent inward whole-cell currents induced by U-tube-applied choline at different membrane potentials. Right, plot of normalized type IA current peak amplitude versus membrane potential. Data are mean ± S.E.M. values from three neurons. In each neuron, the peak amplitude of type IA current at -88 mV was taken as 100% and used to normalize the amplitude recorded at various membrane potentials. B, left, sample recordings represent inward whole-cell currents induced by different concentrations of choline. Right, normalized peak amplitude of type IA currents is plotted against agonist concentration. The peak amplitude by 10 mM choline was taken as 100% in each neuron. Symbols and error bars represent mean and S.E.M., respectively, of results obtained from four SRIs. Solid line passing through the symbols represents the best fit of the data to a Hill equation.
Fig. 4.
Fig. 4.
Pharmacological characterization of types II and III nAChR responses in SRIs. A, sample recordings of inward whole-cell currents evoked by application of ACh to three SRIs at -60 mV before (left traces) or 10 min after bath application of the antagonists (right traces). B, sample recordings of ACh-induced NMDA EPSCs obtained from two SRIs at +40 mV before (left traces) or 10 min after bath application of the antagonists (right traces).
Fig. 5.
Fig. 5.
Physiological factors that influence the magnitude of SRI type IA currents. A, relationship between depth of SRIs from the slice surface and the magnitude of type IA steady-state current. The amplitude of type IA current remaining at 10 s after activating the solenoid valve for agonist delivery is expressed as percentage of the peak current and is shown in the ordinate. SRI depth shown on the abscissa represents the depth of the cell body from the surface of the slice, measured just before making the recordings. Each symbol represents a single neuron. A nonparametric linear regression of the data yielded a statistically significant positive slope. Type IA cells mentioned in all places represent those SRIs exhibiting only type IA currents. B, relationship between depth of SRIs from the slice surface and type IA current peak amplitude. A nonparametric linear regression of the data indicated no significant correlation between the two parameters. C, bar graph shows the peak amplitude of type IA currents in type IA neurons (neurons that exhibit only type IA currents) and in type II neurons (neurons with mixed responses). Numbers in parentheses represent the number of neurons studied. Graph and error bar are mean and S.E.M., respectively, of results obtained from 46 type IA cells and 12 type II cells. *, results are different with p = 0.038 (Student's t test). D and E, relationship between SRI distance from the pyramidal layer and type IA current peak amplitude in type IA (D) and type II (E) cells. The distance was measured from the midline of the pyramidal cell layer to the center of the SRI before making the recordings in the slices. In both cases, a nonparametric linear regression of the data revealed a statistically significant positive slope. F, relationship between the age of guinea pigs and type IA current peak amplitude.
Fig. 6.
Fig. 6.
Relationship between dendrite initial segment thickness and type IA current peak amplitude in SRI. A, photographs of biocytin-filled SRIs reveal thick segments of initial dendrites (indicated by arrows) emerging from the cell body. Traces shown to the right of each photograph represent type IA currents recorded from that particular neuron. B, photographs of biocytin-filled SRIs reveal thin segments of initial dendrites (indicated by arrows) emerging from the cell body. Calibration line in the last photomicrograph applies to all images. Traces shown to the left represent type IA currents recorded in each neuron. Calibration at the bottom applies to all traces. Inset, graph of the peak amplitudes of type IA currents recorded from SRIs with thin (1–2 μm thick) or thick (3–5 μm thick) initial dendritic segments. ***, p < 0.002 by Mann-Whitney test.
Fig. 7.
Fig. 7.
Effects of the acute treatment with galantamine and/or soman on the magnitude of the ratio of ACh- to choline-evoked type IA currents in SRIs. The ratios of ACh (0.1 mM)- to choline (10 mM)-evoked type IA peak amplitudes (top) or net charge (bottom) from several SRIs are shown for the different ages of untreated guinea pigs and for the various times after their treatments with galantamine (8 mg/kg i.m.) and/or soman (1× LD50 s.c.). It was assumed that AChE inhibition in the slices would modify only the response evoked by the subsaturating concentration of ACh and, therefore, change the ACh/choline ratio. Graph and error bars are mean and S.E.M., respectively, of results obtained from different neurons. Numbers in parentheses represent the number of SRIs in each group. Inset trace pairs shown in the bottom graph are representative samples of type IA currents induced by 10 mM choline (black traces) or 0.1 mM ACh (gray traces) in a given SRI in the control and soman group. The animals were treated as described under Material and Methods. *, p = 0.05; **, p = 0.006 compared with control by Mann-Whitney test.
Fig. 8.
Fig. 8.
Effect of the acute treatments with galantamine and/or soman on choline-evoked type IA currents in CA1 SRIs. Graph of peak amplitudes (left graphs) or net charge (right graphs) of type IA currents recorded from SRIs in hippocampal slices taken from animals at different ages or at various times after a given treatment. The net charge of type IA currents was calculated for 12 s of the trace starting from the trigger applied at the solenoid valve. Only type IA cells were included in this analysis. Control group of animals were in the age ranges of P11 to P12 (top), P16 to P19 (middle), and P25 and P26 (bottom). Drug-treated groups were age-matched to controls and obtained 1, 7, or 14 days (top, middle, and bottom, respectively) after any given treatment. Graph and error bars are mean and S.E.M., respectively, of results from seven to 17 neurons. Numbers in parentheses represent the number of neurons studied in each experimental group.
Fig. 9.
Fig. 9.
Effect of the acute treatment with soman on type IA currents in different CA1 interneurons. Graph of peak amplitudes or net charge of type IA currents recorded from CA1 SRIs, SPIs, and SOIs in hippocampal slices taken from untreated or soman (1× LD50)-challenged guinea pigs. Data from animals at ages between P11 and P26 were pooled together for each neuron type. Inset, representative sample recordings of choline-evoked currents recorded from SOIs in hippocampal slices of untreated and soman-treated guinea pigs. Graph and error bars are mean and S.E.M., respectively, of results from various neurons. Numbers in parentheses represent the number of neurons studied in each experimental group. *, p = 0.02 compared with control according to the unpaired Student's t test.
Fig. 10.
Fig. 10.
Effect of the acute treatments with galantamine and/or soman on the percentage of CA1 SRIs exhibiting type II currents in response to ACh. A, bar graph depicts the percentage of CA1 SRIs that respond to ACh (0.1 mM) with type IA or type II currents in various groups of animals. Ordinate, number of neurons showing type IA or type II currents. Note that all type II current neurons also had type IA currents. The percentage of neurons responding to ACh with type II currents in each group is shown at the top. Results obtained from P11 to P26 animals were grouped together. In each treatment group, results obtained from slices taken from the guinea pigs at 1, 7, and 14 days after that treatment were pooled together. The prevalence of type II currents in CA1 SRIs of galantamine-treated animals is significantly lower compared with control by Fisher's exact test (*, p = 0.017). B, results for each treatment group are categorized according to the age of the animals and the time after a given treatment. C, bar graph depicts the peak amplitude and net charge of type II currents recorded from SRIs of control and soman-challenged animals. Results from all age groups were pooled together. Graph and error bars are mean and S.E.M., respectively, of results obtained from various neurons. Numbers in parentheses represent the number of neurons studied in each experimental group.
Fig. 11.
Fig. 11.
Effects of acute treatments with soman and/or galantamine on type III responses recorded from CA1 SRIs. A, ACh-induced NMDA EPSCs recorded from CA1 SRI at +40 mV in hippocampal slices from different groups of animals. B, bar graph shows the magnitude of type III responses recorded from CA1 SRIs of animals subjected to various treatments. Results obtained from P11 to P26 control animals were grouped together. Drug-treated group consists of animals at 1, 7, and 14 days after a given treatment. Graph and error bars are mean and S.E.M., respectively, of results obtained from various neurons. Numbers in parentheses are the number of neurons studied in each experimental group. The groups “soman mild” and “soman severe” refer to groups of animals that presented mild reactions and severe reactions, including long-lasting intermittent convulsions. *, p < 0.01 and ***, p < 0.001 compared with control; ** p < 0.01 compared with soman severe by Mann-Whitney nonparametric analysis.
Fig. 12.
Fig. 12.
Changes in CA1 SOI morphology after injections of soman. Neurolucida drawings of biocytin-filled CA1 SOIs of a control and a soman (1× LD50)-challenged guinea pig 1 day after an acute treatment with soman. SOI axons are largely confined to the SO in control animals and largely sprouted to the SO, stratum pyramidale, and SR in soman-challenged animals.
Fig. 13.
Fig. 13.
Scheme illustrating the network effect of soman and galantamine. The pyramidal neuron (P) in the CA1 hippocampal region receives inhibitory inputs from various interneurons. The SRI provides the feed-forward inhibition, whereas both SOI and SPI provide feedback inhibition to the pyramidal neurons. Soman suppresses feedback inhibition (i.e., causes disinhibition) via inhibition of type IA currents in SOI and SPI. Soman enhances feed-forward inhibition via enhancement of ACh-induced type IA currents and via increase in the number of SRI with type II currents. Soman-induced imbalance in feed-forward and feedback inhibition results in increased pyramidal neuron firing leading to excitotoxicity, neuronal damage, and altered rhythm. The loss of pyramidal neurons partly contributes to a decrease in type III nAChR activity after exposure to soman. Galantamine opposes the action of soman by preventing irreversible inhibition of AChE, leading to preservation of nAChR activity, and/or by inducing changes in the expression of nAChRs in the interneurons, thereby restoring the balance of nAChR-dependent feed-forward and feedback inhibition in the hippocampal neurocircuitry.

References

    1. Albuquerque EX, Deshpande SS, Kawabuchi M, Aracava Y, Idriss M, Rickett DL, and Boyne AF (1985) Multiple actions of anticholinesterase agents on chemosensitive synapses: molecular basis for prophylaxis and treatment of organophosphate poisoning. Fundam Appl Toxicol 5 S182-S203. - PubMed
    1. Albuquerque EX, Pereira EFR, Aracava Y, Fawcett WP, Oliveira M, Randall WR, Hamilton TA, Kan RK, Romano JA Jr, and Adler M (2006) Effective countermeasure against poisoning by organophosphorus insecticides and nerve agents. Proc Natl Acad Sci U S A 103 13220-13225. - PMC - PubMed
    1. Alkondon M and Albuquerque EX (2001) Nicotinic acetylcholine receptor α7 and α4β2 subtypes differentially control GABAergic input to CA1 neurons in rat hippocampus. J Neurophysiol 86 3043-3055. - PubMed
    1. Alkondon M and Albuquerque EX (2004) The nicotinic acetylcholine receptor subtypes and their function in the hippocampus and cerebral cortex. Prog Brain Res 145 109-120. - PubMed
    1. Alkondon M and Albuquerque EX (2005) Nicotinic receptor subtypes in rat hippocampal slices are differentially sensitive to desensitization and early in vivo functional up-regulation by nicotine and to block by bupropion. J Pharmacol Exp Ther 313 740-750. - PubMed

Publication types