. 2008 Dec;82(24):12094-103.
doi: 10.1128/JVI.01730-08. Epub 2008 Oct 8.

Human immunodeficiency virus type 1 superinfection occurs despite relatively robust neutralizing antibody responses

Affiliations

Human immunodeficiency virus type 1 superinfection occurs despite relatively robust neutralizing antibody responses

Catherine A Blish et al. J Virol. 2008 Dec.

Abstract

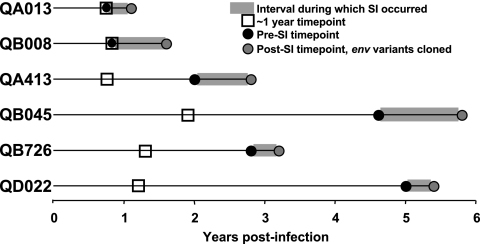
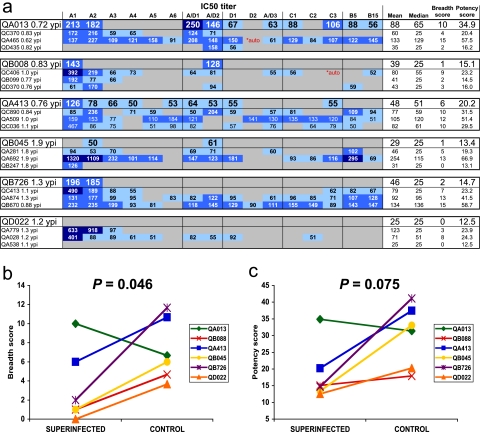
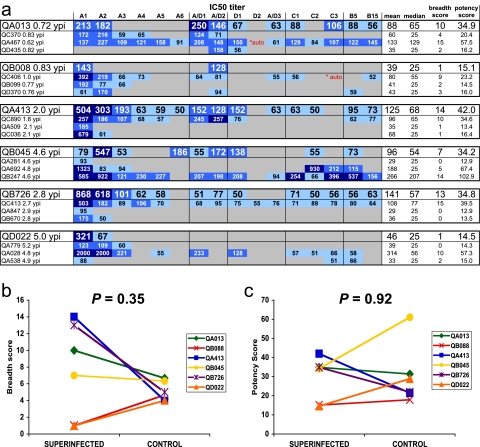
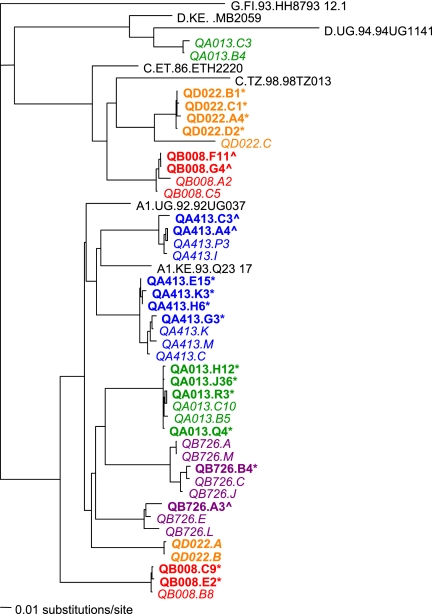
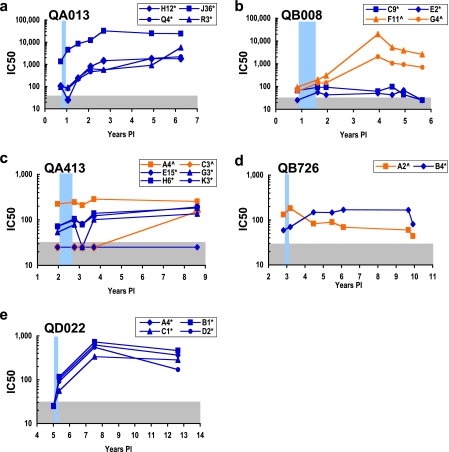
Superinfection by a second human immunodeficiency virus type 1 (HIV-1) strain indicates that gaps in protective immunity occur during natural infection. To define the role of HIV-1-specific neutralizing antibodies (NAbs) in this setting, we examined NAb responses in 6 women who became superinfected between approximately 1 to 5 years following initial infection compared to 18 women with similar risk factors who did not. Although superinfected individuals had less NAb breadth than matched controls at approximately 1 year postinfection, no significant differences in the breadth or potency of NAb responses were observed just prior to the second infection. In fact, four of the six subjects had relatively broad and potent NAb responses prior to infection by the second strain. To more specifically examine the specificity of the NAbs against the superinfecting virus, these variants were cloned from five of the six individuals. The superinfecting variants did not appear to be inherently neutralization resistant, as measured against a pool of plasma from unrelated HIV-infected individuals. Moreover, the superinfected individuals were able to mount autologous NAb responses to these variants following reinfection. In addition, most superinfected individuals had NAbs that could neutralize their second viral strains prior to their reinfection, suggesting that the level of NAbs elicited during natural infection was not sufficient to block infection. These data indicate that preventing infection by vaccination will likely require broader and more potent NAb responses than those found in HIV-1-infected individuals.


Figures

FIG. 1.
FIG. 1.
Timing of analyzed samples for the six superinfection cases. Each of the six superinfection cases is identified on the left, with a horizontal line indicating the time since the initial infection, according to the scale at the bottom. The interval during which superinfection occurred is indicated by the gray bar. The ∼1-year time point from which plasma samples were evaluated is indicated by the open squares, and the presuperinfection time point is indicated by the black circles. For subjects QA013 and QB008, the ∼1-year time point and the presuperinfection time point were the same since superinfection occurred at approximately 1 year. The gray circles indicate the first time point at which the superinfecting variants were identified; all env variants were cloned from this time point. SI, superinfection.
FIG. 2.
FIG. 2.
NAb responses at approximately 1 ypi. (a) The plasma samples tested are displayed along the left, with a subject identification code followed by the number of years postinfection at which the plasma sample was obtained. Each superinfection case is displayed in larger font at the top of a group, with the three matched controls in the box beneath. The 16 viruses tested are shown at the top, followed by a column for the mean, median, breadth score, and potency scores for each plasma sample (four rightmost columns). The 16 panel viruses are abbreviated by subtype along the top. The virus variants are: A1, Q461d1; A2, Q168b23; A3, Q842d16; A4, BJ613.E1; A5, BS208.B1; A6,Q769b9; A/D1, BF535.A1; A/D2, QA790.204I.ENV.C1; D1, QD435.100 M.ENV.A4; D2, QA465.59 M.ENV.D1; A/D3, QZ100.ENV.D83; C1, Du156.12; C2,QB099.391 M.ENV.C8; C3, QC406.70 M.ENV.F3; B5, 6535.3; B15, THRO4156.18. IC50 values are shown as numerical values in the table. The data are color coded, with darker blue boxes denoting more potent neutralization. A gray bar indicates that <50% neutralization was observed at a plasma dilution of 1:50, which was the highest dilution tested. For the purposes of statistical analyses, these IC50 values were assigned a level of 25. The two values marked “*auto” in red indicate that the plasma sample was autologous to the panel virus and was therefore not included in calculation of the breadth and potency scores. (b) Comparison of breadth scores between superinfection cases and the average value from the three matched controls for each case. Breadth scores are shown along the y axis, and the superinfecting and control groups are compared along the x axis. The lines between the data points denote comparison between the superinfection cases and the matched controls. P values for the superinfection cases compared to controls were obtained by comparing scores with the Wilcoxon signed ranks test. (c) Comparison of potency scores, displayed as per breadth scores in panel b.
FIG. 3.
FIG. 3.
NAb responses immediately prior to superinfection. (a) IC50 values for plasma/virus combinations are presented as described in the legend to Fig. 2a. Here, the viruses tested are the same as in the experiment shown in Fig. 2, but the plasma tested was from a different time point, i.e., the time point immediately prior to documented superinfection. (b) Comparison of breadth scores between superinfection cases and matched controls prior to superinfection as described in the legend of Fig. 2b. (c) Comparison of potency scores between superinfection cases and matched controls prior to superinfection as described in the legend of Fig. 2c.
FIG. 4.
FIG. 4.
Neighbor-joining phylogenetic tree of V2-V5 sequences from superinfection cases. Reference sequences for subtype G, D, C, and A from the Los Alamos HIV database (http://www.hiv.lanl.gov/content/index) are displayed in black. Sequences from each subject are denoted in a separate color. For reference, sequences that were originally obtained from these cases using primers that amplify a subgenomic portion of envelope (V1-V5) (7, 38) are shown in italics. The case reference sequences were obtained from the first time point at which the superinfecting variants were detected and contain representatives of both the initial and superinfecting strains, except for case QD022, in which the superinfecting variants completely replaced the initial variants. Thus, the QD022.A and QD022.B initial sequences in bold italics were from a presuperinfection time point (0.14 ypi). Sequences from the full-length env clones from these same individuals isolated as part of this study are shown in bold print, with an asterisk denoting a superinfecting sequence and a caret denoting a sequence from the initial virus population, as defined in the previous study. Full-length envelope sequences were cloned either directly from PBMC DNA (subjects QA013, QB726, and QA413) or from PBMC DNA following short-term coculture with uninfected PBMCs (subjects QB008 and QD022) from the first time point at which superinfecting sequences were detected.
FIG. 5.
FIG. 5.
Neutralization of superinfecting and initial variants by plasma from the superinfected individuals. Each panel represents the evolving NAb response in the superinfected subject indicated in the upper left. The autologous plasma IC50 value against the various initial and superinfecting env variants is plotted over time. Superinfecting variants are denoted with blue symbols, and initial variants are indicated with orange symbols. All the env variants were cloned from the time point immediately after superinfection, and the light-blue bars denote the interval in which superinfection occurred. The gray bar indicates the limit of detection of our assay. When a virus was neutralized <50% at a plasma dilution of 1:50, the highest dilution tested, the IC50 value was assigned a level of 25 and is within the gray area. PI, postinfection.

References

    1. Altfeld, M., T. M. Allen, X. G. Yu, M. N. Johnston, D. Agrawal, B. T. Korber, D. C. Montefiori, D. H. O'Connor, B. T. Davis, P. K. Lee, E. L. Maier, J. Harlow, P. J. Goulder, C. Brander, E. S. Rosenberg, and B. D. Walker. 2002. HIV-1 superinfection despite broad CD8+ T-cell responses containing replication of the primary virus. Nature 420434-439. - PubMed
    1. Beirnaert, E., P. Nyambi, B. Willems, L. Heyndrickx, R. Colebunders, W. Janssens, and G. van der Groen. 2000. Identification and characterization of sera from HIV-infected individuals with broad cross-neutralizing activity against group M (Env clade A-H) and group O primary HIV-1 isolates. J. Med. Virol. 6214-24. - PubMed
    1. Blish, C., R. Nedellec, K. Mandaliya, D. Mosier, and J. Overbaugh. 2007. HIV-1 subtype A envelope variants from early in infection have variable sensitivity to neutralization and to inhibitors of viral entry. AIDS 6693-702. - PubMed
    1. Bocher, W. O., S. Herzog-Hauff, W. Herr, K. Heermann, G. Gerken, K. H. Meyer Zum Buschenfelde, and H. F. Lohr. 1996. Regulation of the neutralizing anti-hepatitis B surface (HBs) antibody response in vitro in HBs vaccine recipients and patients with acute or chronic hepatitis B virus (HBV) infection. Clin. Exp. Immunol. 10552-58. - PMC - PubMed
    1. Brown, S. A., J. L. Hurwitz, X. Zhan, P. C. Doherty, and K. S. Slobod. 2005. CD8+ T-cells: are they sufficient to prevent, contain or eradicate HIV-1 infection? Curr. Drug Targets Infect. Disord. 5113-119. - PubMed

Publication types

Substances