. 2008 Dec;148(4):1740-59.
doi: 10.1104/pp.108.127902. Epub 2008 Oct 8.

Differential accumulation of retroelements and diversification of NB-LRR disease resistance genes in duplicated regions following polyploidy in the ancestor of soybean

Affiliations

Differential accumulation of retroelements and diversification of NB-LRR disease resistance genes in duplicated regions following polyploidy in the ancestor of soybean

Roger W Innes et al. Plant Physiol. 2008 Dec.

Abstract

The genomes of most, if not all, flowering plants have undergone whole genome duplication events during their evolution. The impact of such polyploidy events is poorly understood, as is the fate of most duplicated genes. We sequenced an approximately 1 million-bp region in soybean (Glycine max) centered on the Rpg1-b disease resistance gene and compared this region with a region duplicated 10 to 14 million years ago. These two regions were also compared with homologous regions in several related legume species (a second soybean genotype, Glycine tomentella, Phaseolus vulgaris, and Medicago truncatula), which enabled us to determine how each of the duplicated regions (homoeologues) in soybean has changed following polyploidy. The biggest change was in retroelement content, with homoeologue 2 having expanded to 3-fold the size of homoeologue 1. Despite this accumulation of retroelements, over 77% of the duplicated low-copy genes have been retained in the same order and appear to be functional. This finding contrasts with recent analyses of the maize (Zea mays) genome, in which only about one-third of duplicated genes appear to have been retained over a similar time period. Fluorescent in situ hybridization revealed that the homoeologue 2 region is located very near a centromere. Thus, pericentromeric localization, per se, does not result in a high rate of gene inactivation, despite greatly accelerated retrotransposon accumulation. In contrast to low-copy genes, nucleotide-binding-leucine-rich repeat disease resistance gene clusters have undergone dramatic species/homoeologue-specific duplications and losses, with some evidence for partitioning of subfamilies between homoeologues.


Figures

Figure 1.
Figure 1.
Phylogenetic relationships of taxa and their genomes. Divergence times (million years) are from Lavin et al. (2005). A, Species relationships. Black squares mark polyploidy events. B, Expected relationships among genomes and their genes. Black squares mark duplications produced by polyploidy events. Two successive whole genome duplications in the ancestor of Glycine lead to the expectation of a maximum of four homoeologues in modern Glycine species.
Figure 2.
Figure 2.
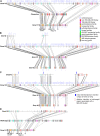
Alignment of homoeologous and orthologous BAC contigs. Vertical filled rectangles represent protein-coding genes other than retrotransposon-associated proteins, and open blue rectangles, shown in a separate track, represent retrotransposons. Solid lines between contigs indicate allelic, homoeologous, or orthologous genes. Supplemental Figure S2 shows a larger version of this figure that includes gene names. A, Comparison of soybean H1 and H2 with Phaseolus. Dotted lines between the H1 and H2 contigs indicate homoeologous genes that either are not present in the orthologous region of Phaseolus or are positioned outside of the region sequenced in Phaseolus. B, Comparison of soybean H1 and H2 with their orthologues in G. tomentella. C, Comparison of soybean cv Williams 82 and line PI96983. Dashed rectangles indicate NB-LRR clusters that differ in gene content between these two genotypes. D, Comparison of soybean H1 and H2 and Medicago. E, Comparison of soybean H1, H2, and H3.
Figure 2.
Figure 2.
Alignment of homoeologous and orthologous BAC contigs. Vertical filled rectangles represent protein-coding genes other than retrotransposon-associated proteins, and open blue rectangles, shown in a separate track, represent retrotransposons. Solid lines between contigs indicate allelic, homoeologous, or orthologous genes. Supplemental Figure S2 shows a larger version of this figure that includes gene names. A, Comparison of soybean H1 and H2 with Phaseolus. Dotted lines between the H1 and H2 contigs indicate homoeologous genes that either are not present in the orthologous region of Phaseolus or are positioned outside of the region sequenced in Phaseolus. B, Comparison of soybean H1 and H2 with their orthologues in G. tomentella. C, Comparison of soybean cv Williams 82 and line PI96983. Dashed rectangles indicate NB-LRR clusters that differ in gene content between these two genotypes. D, Comparison of soybean H1 and H2 and Medicago. E, Comparison of soybean H1, H2, and H3.
Figure 3.
Figure 3.
Phylogenetic analysis and physical map of NB-LRR genes. A, Bayesian tree of non-TIR-NB-LRRs of the Rpg1-b syntenic region. This tree was constructed using just the NB domains (from the P-loop to the MHD motif). NB-LRR names are colored according to major clades. Gene names are abbreviated as follows: gmw, G. max cv Williams 82; gmp, G. max line PI96983; gtd, G. tomentella diploid accession G1403; pva, P. vulgaris Andean accession G19833; Mt, M. truncatula var Jemalong. B, Physical map of NB-LRRs of the Rpg1-b syntenic region. Vertical black lines represent sequenced BAC contigs from the different genotypes and homoeologues. Vertical gray lines represent chromosome 8 of Medicago and WGS 7x scaffolds 172 and 55 of homoeologues 1 and 2 from soybean cv Williams 82. Arrows represent predicted TIR (orange borders) or non-TIR (black borders) NB-LRR genes and their orientation. Fill colors of non-TIR-NB-LRR genes correspond to the colors of the clades defined by the non-TIR tree (A). White NB-LRRs are pseudogenes with partial or total deletion of the NB region, or genes that showed evidence of recombination within the NB region, and thus were not included in the phylogenetic analysis. Horizontal lines represent low-copy genes conserved between species, genotypes, or homoeologues, which were used to align these regions. C, Bayesian tree of TIR NB-LRRs of the Rpg1-b syntenic region.
Figure 4.
Figure 4.
Phylogenetic analysis of carbohydrate transporter and kinase families. A, Carbohydrate transporter family. B, Kinase family. Red text indicates genes from Glycine H1, blue text indicates Glycine H2, and violet text indicates Glycine H3. Gene names are abbreviated as in Figure 3A, with the addition of gtt indicating G. tomentella tetraploid species G1134 and At indicating Arabidopsis. Both trees were constructed using Bayesian analysis. Numbers at nodes indicate posterior probabilities.

References

    1. Adams KL, Cronn R, Percifield R, Wendel JF (2003) Genes duplicated by polyploidy show unequal contributions to the transcriptome and organ-specific reciprocal silencing. Proc Natl Acad Sci USA 100 4649–4654 - PMC - PubMed
    1. Adams KL, Percifield R, Wendel JF (2004) Organ-specific silencing of duplicated genes in a newly synthesized cotton allotetraploid. Genetics 168 2217–2226 - PMC - PubMed
    1. Akkaya MS, Bhagwat AA, Cregan PB (1995) Integration of simple sequence repeat DNA markers into a soybean linkage map. Crop Sci 35 1439–1445
    1. Altschul SF, Madden TL, Schaffer AA, Zhang J, Zhang Z, Miller W, Lipman DJ (1997) Gapped BLAST and PSI-BLAST: a new generation of protein database search programs. Nucleic Acids Res 25 3389–3402 - PMC - PubMed
    1. Ashfield T, Bocian A, Held D, Henk AD, Marek LF, Danesh D, Penuela S, Meksem K, Lightfoot DA, Young ND, et al (2003) Genetic and physical localization of the soybean Rpg1-b disease resistance gene reveals a complex locus containing several tightly linked families of NBS-LRR genes. Mol Plant Microbe Interact 16 817–826 - PubMed

Publication types

LinkOut - more resources