

Short intracortical and surround inhibition are selectively reduced during movement initiation in focal hand dystonia
- PMID: 18842895
- PMCID: PMC4757491
- DOI: 10.1523/JNEUROSCI.3564-08.2008
Short intracortical and surround inhibition are selectively reduced during movement initiation in focal hand dystonia
Abstract
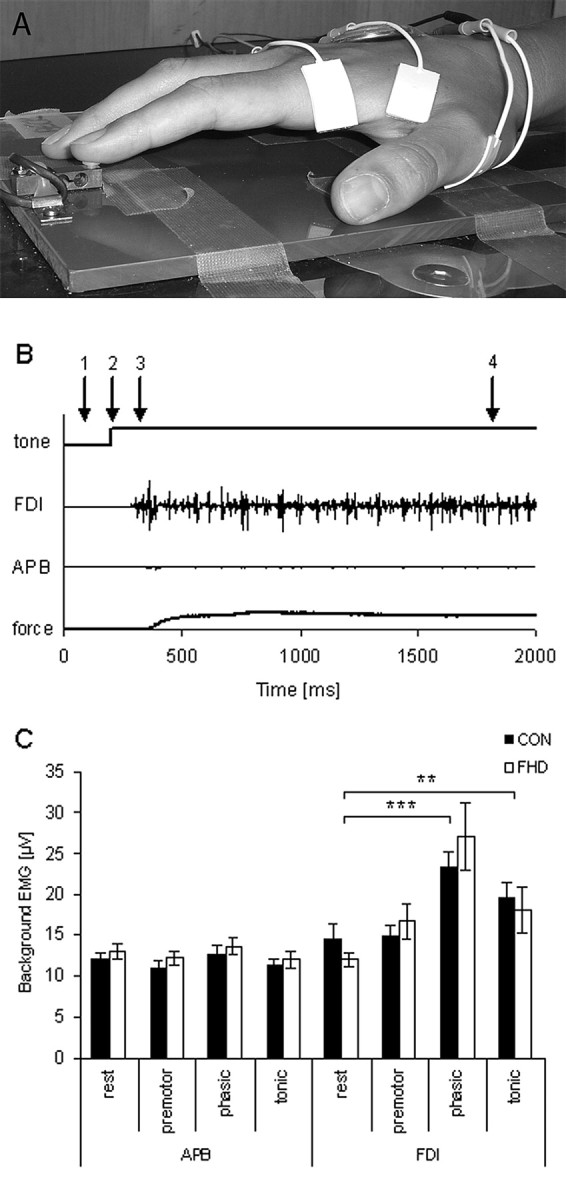
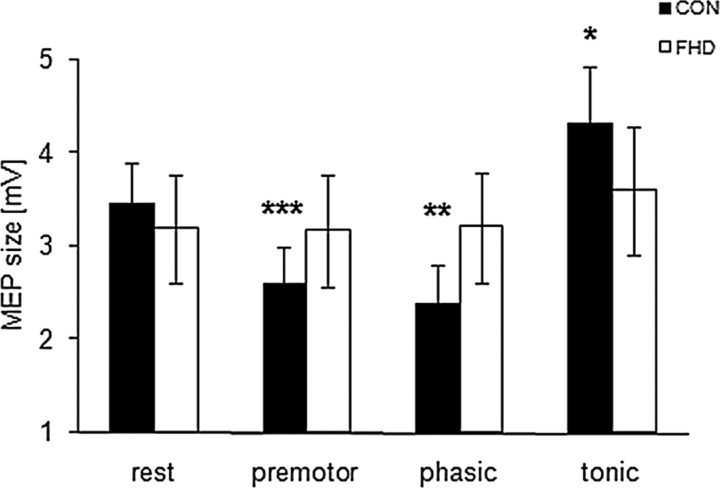
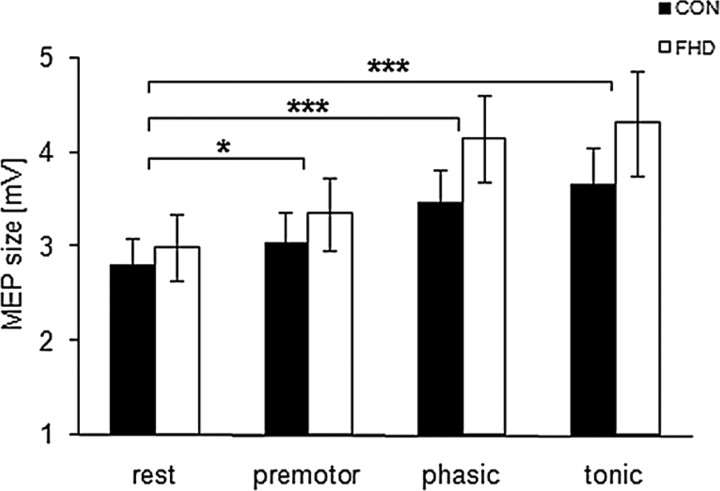
In patients with focal hand dystonia (FHD), pathological overflow activation occurs in muscles not involved in the movement. Surround inhibition is a neural mechanism that can sharpen desired movement by inhibiting unwanted movement in adjacent muscles. To further establish the phenomenon of surround inhibition and to determine whether short intracortical inhibition (SICI) reflecting inhibition from the local interneurons in primary motor cortex (M1), might play a role in its genesis, single- and paired-pulse transcranial magnetic stimulation (TMS), and Hoffmann reflex testing were applied to evaluate the excitability of the relaxed abductor pollicis brevis muscle (APB) at various intervals during a movement of the index finger in 16 patients with FHD and 20 controls. Whereas controls showed inhibition of APB motor-evoked potential (MEP) size during movement initiation and facilitation of APB MEP size during the maintenance phase, FHD patients did not modulate APB MEP size. In contrast, SICI remained constant in controls, but FHD patients showed reduced SICI during movement initiation. The H(max)/M(max) ratio in control subjects increased during movement initiation. The results provide additional evidence for the presence of surround inhibition in M1, where it occurs only during movement initiation, indicating that different mechanisms underlie movement initiation and maintenance. Thus, surround inhibition is sculpted both in time and space and may be an important neural mechanism during movement initiation to counteract increased spinal excitability. SICI may contribute to its generation, because in patients with FHD, the lack of depression of APB MEP size is accompanied by a reduction in SICI.
Figures


References
-
- Angelucci A, Levitt JB, Lund JS. Anatomical origins of the classical receptive field and modulatory surround field of single neurons in macaque visual cortical area V1. Prog Brain Res. 2002;136:373–388. - PubMed
-
- Blakemore C, Carpenter RH, Georgeson MA. Lateral inhibition between orientation detectors in the human visual system. Nature. 1970;228:37–39. - PubMed
-
- Chen R. Interactions between inhibitory and excitatory circuits in the human motor cortex. Exp Brain Res. 2004;154:1–10. - PubMed
-
- Chen R, Hallett M. Focal dystonia and repetitive motion disorders. Clin Orthop Relat Res. 1998:102–106. - PubMed
-
- Chen R, Wassermann EM, Caños M, Hallett M. Impaired inhibition in writer's cramp during voluntary muscle activation. Neurology. 1997;49:1054–1059. - PubMed
Publication types
MeSH terms
Grants and funding
LinkOut - more resources
Full Text Sources