Targeting of RGS7/Gbeta5 to the dendritic tips of ON-bipolar cells is independent of its association with membrane anchor R7BP
- PMID: 18842904
- PMCID: PMC2587022
- DOI: 10.1523/JNEUROSCI.3282-08.2008
Targeting of RGS7/Gbeta5 to the dendritic tips of ON-bipolar cells is independent of its association with membrane anchor R7BP
Abstract
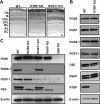
Complexes of regulator of G-protein signaling (RGS) proteins with G-protein beta5 (Gbeta5) subunits are essential components of signaling pathways that regulate the temporal characteristics of light-evoked responses in vertebrate retinal photoreceptors and ON-bipolar cells. Recent studies have found that RGS/Gbeta5 complexes bind to a new family of adapter proteins, R9AP (RGS9 anchor protein) and R7 family binding protein (R7BP), that in case of the RGS9/Gbeta5 complex were shown to determine its precise subcellular targeting to either the outer segment of photoreceptors or postsynaptic structures of striatal neurons, respectively. In this study, we establish that another trimeric complex consisting of RGS7, Gbeta5, and R7BP subunits is specifically targeted to the dendritic tips of retinal bipolar cells. However, examination of the mechanisms of complex targeting in vivo surprisingly revealed that the delivery of RGS7/Gbeta5 to the dendrites of ON-bipolar cells occurs independently of its association with R7BP. These findings provide a new mechanism for adapter-independent targeting of RGS/Gbeta5 complexes.
Figures


Similar articles
-
R9AP stabilizes RGS11-G beta5 and accelerates the early light response of ON-bipolar cells.Vis Neurosci. 2010 Mar;27(1-2):9-17. doi: 10.1017/S0952523809990319. Epub 2010 Jan 26. Vis Neurosci. 2010. PMID: 20100392 Free PMC article.
-
Membrane anchoring subunits specify selective regulation of RGS9·Gbeta5 GAP complex in photoreceptor neurons.J Neurosci. 2010 Oct 13;30(41):13784-93. doi: 10.1523/JNEUROSCI.1191-10.2010. J Neurosci. 2010. PMID: 20943919 Free PMC article.
-
Gbeta5-RGS complexes co-localize with mGluR6 in retinal ON-bipolar cells.Eur J Neurosci. 2007 Nov;26(10):2899-905. doi: 10.1111/j.1460-9568.2007.05867.x. Eur J Neurosci. 2007. PMID: 18001285 Free PMC article.
-
Structure, function, and localization of Gβ5-RGS complexes.Prog Mol Biol Transl Sci. 2009;86:157-203. doi: 10.1016/S1877-1173(09)86006-7. Epub 2009 Oct 7. Prog Mol Biol Transl Sci. 2009. PMID: 20374716 Free PMC article. Review.
-
R9AP and R7BP: traffic cops for the RGS7 family in phototransduction and neuronal GPCR signaling.Trends Pharmacol Sci. 2009 Jan;30(1):17-24. doi: 10.1016/j.tips.2008.10.002. Epub 2008 Nov 29. Trends Pharmacol Sci. 2009. PMID: 19042037 Free PMC article. Review.
Cited by
-
The Transduction Cascade in Retinal ON-Bipolar Cells: Signal Processing and Disease.Annu Rev Vis Sci. 2017 Sep 15;3:25-51. doi: 10.1146/annurev-vision-102016-061338. Epub 2017 Jul 17. Annu Rev Vis Sci. 2017. PMID: 28715957 Free PMC article. Review.
-
Membrane anchor R9AP potentiates GTPase-accelerating protein activity of RGS11 x Gbeta5 complex and accelerates inactivation of the mGluR6-G(o) signaling.J Biol Chem. 2010 Feb 12;285(7):4781-7. doi: 10.1074/jbc.M109.058511. Epub 2009 Dec 11. J Biol Chem. 2010. PMID: 20007977 Free PMC article.
-
Dark-adapted response threshold of OFF ganglion cells is not set by OFF bipolar cells in the mouse retina.J Neurophysiol. 2012 May;107(10):2649-59. doi: 10.1152/jn.01202.2011. Epub 2012 Feb 15. J Neurophysiol. 2012. PMID: 22338022 Free PMC article.
-
The R7 RGS protein family: multi-subunit regulators of neuronal G protein signaling.Cell Biochem Biophys. 2009;54(1-3):33-46. doi: 10.1007/s12013-009-9052-9. Epub 2009 Jun 12. Cell Biochem Biophys. 2009. PMID: 19521673 Free PMC article. Review.
-
Orphan Receptor GPR158 Is an Allosteric Modulator of RGS7 Catalytic Activity with an Essential Role in Dictating Its Expression and Localization in the Brain.J Biol Chem. 2015 May 29;290(22):13622-39. doi: 10.1074/jbc.M115.645374. Epub 2015 Mar 19. J Biol Chem. 2015. PMID: 25792749 Free PMC article.
References
-
- Anderson GR, Semenov A, Song JH, Martemyanov KA. The membrane anchor R7BP controls the proteolytic stability of the striatal specific RGS protein, RGS9-2. J Biol Chem. 2007a;282:4772–4781. - PubMed
-
- Anderson GR, Lujan R, Semenov A, Pravetoni M, Posokhova EN, Song JH, Uversky V, Chen CK, Wickman K, Martemyanov KA. Expression and localization of RGS9-2/G 5/R7BP complex in vivo is set by dynamic control of its constitutive degradation by cellular cysteine proteases. J Neurosci. 2007b;27:14117–14127. - PMC - PubMed
-
- Arimura N, Kaibuchi K. Neuronal polarity: from extracellular signals to intracellular mechanisms. Nat Rev Neurosci. 2007;8:194–205. - PubMed
-
- Ballon DR, Flanary PL, Gladue DP, Konopka JB, Dohlman HG, Thorner J. DEP-domain-mediated regulation of GPCR signaling responses. Cell. 2006;126:1079–1093. - PubMed
-
- Burns ME, Arshavsky VY. Beyond counting photons: trials and trends in vertebrate visual transduction. Neuron. 2005;48:387–401. - PubMed
Publication types
MeSH terms
Substances
Grants and funding
LinkOut - more resources
Full Text Sources
Molecular Biology Databases
Miscellaneous
