. 2008 Dec;100(6):3074-85.
doi: 10.1152/jn.90399.2008. Epub 2008 Oct 8.

Effects of odor stimulation on antidromic spikes in olfactory sensory neurons

Affiliations

Effects of odor stimulation on antidromic spikes in olfactory sensory neurons

John W Scott et al. J Neurophysiol. 2008 Dec.

Abstract

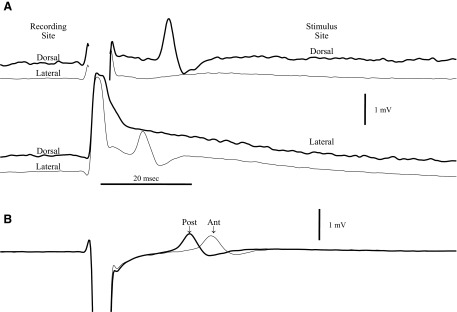
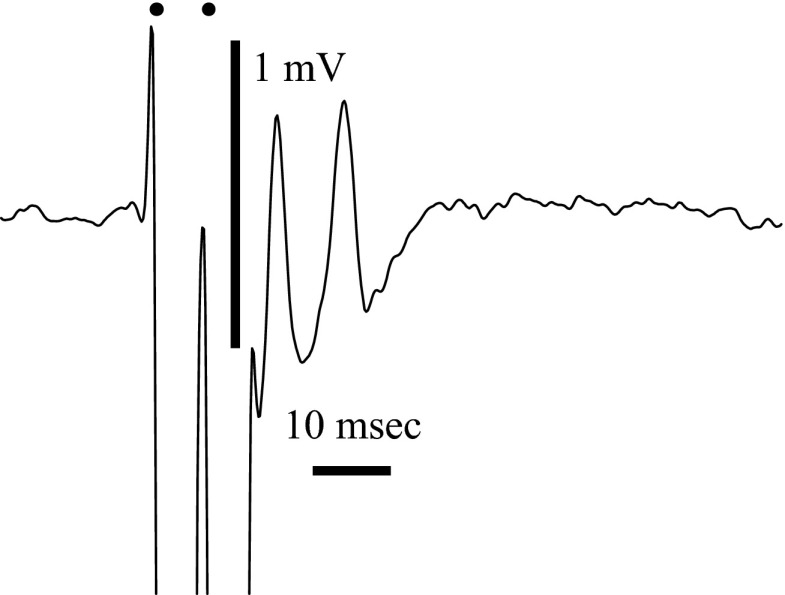
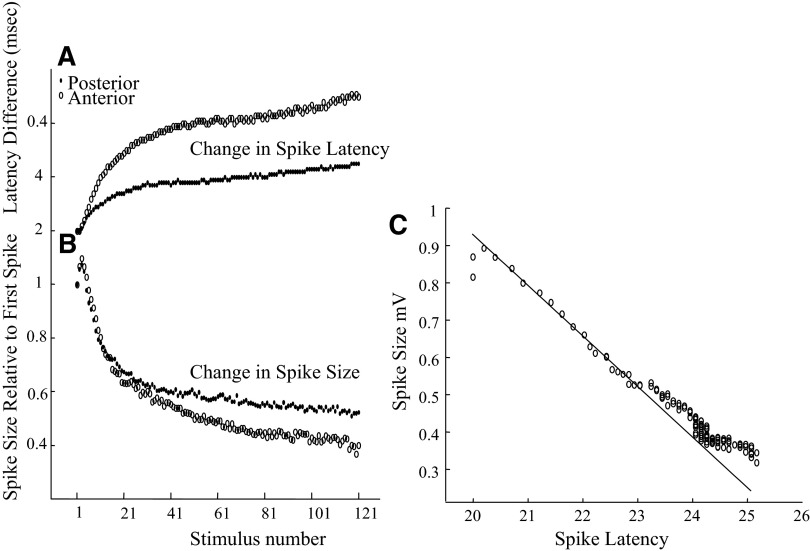
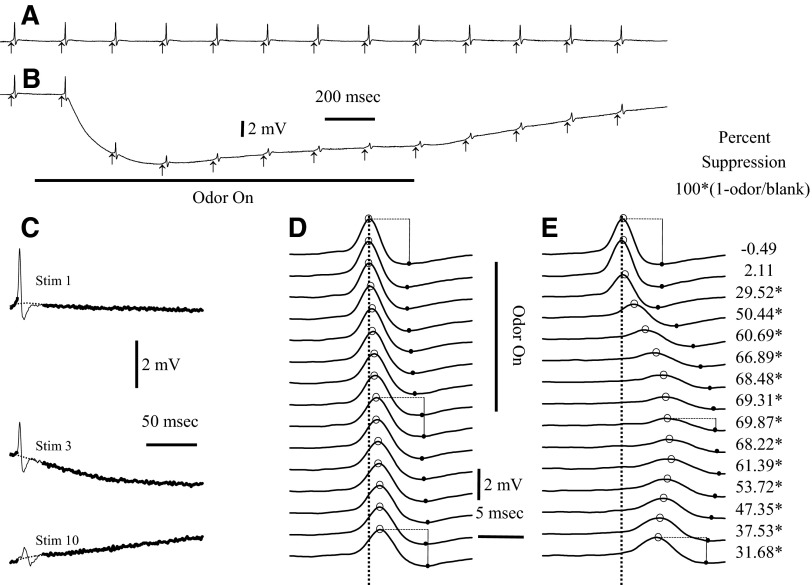
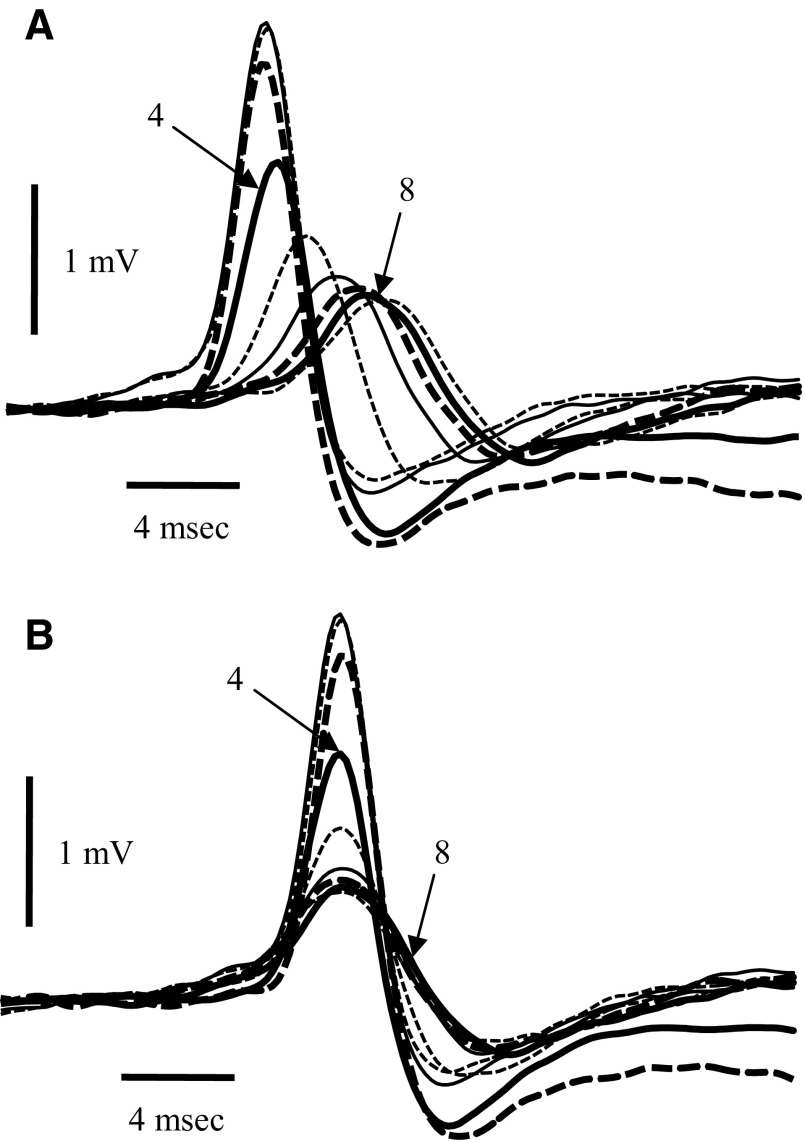
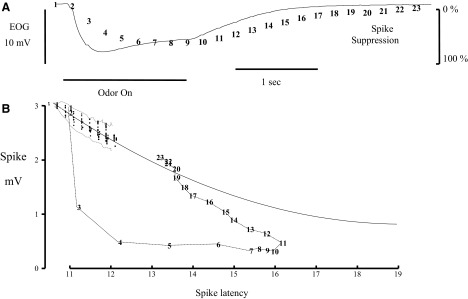
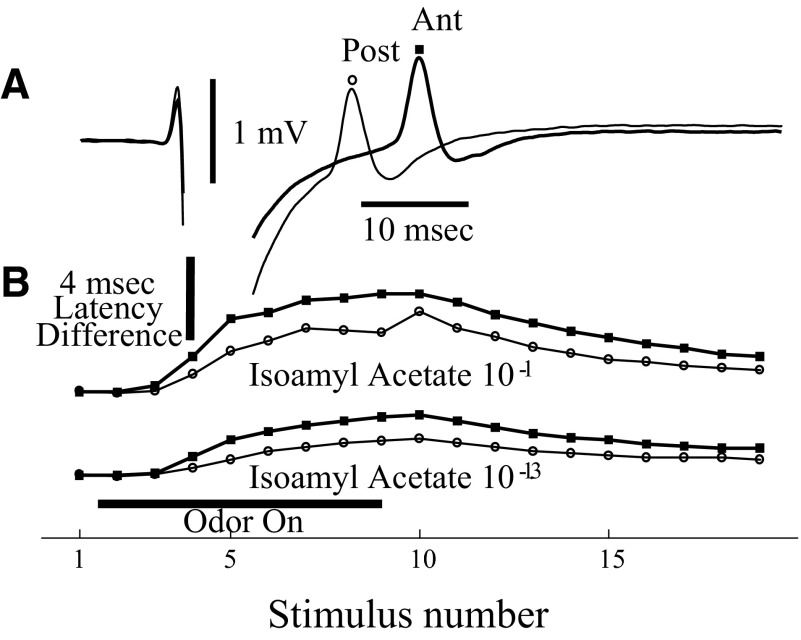
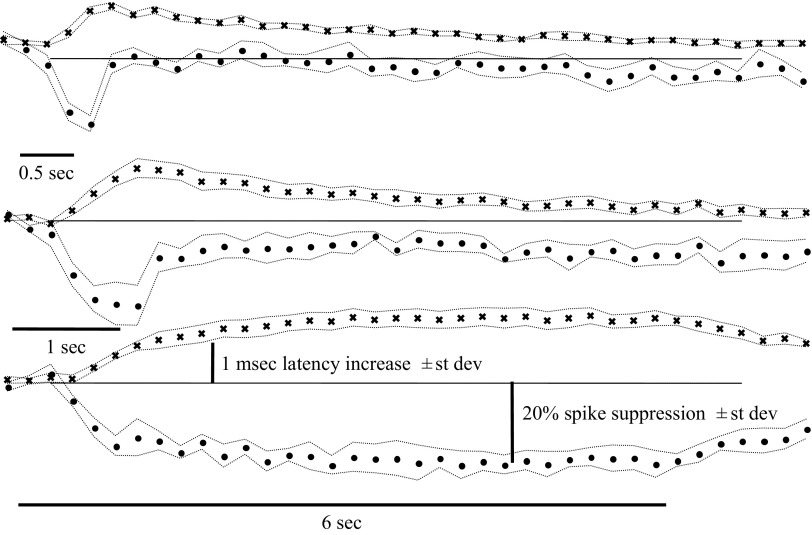
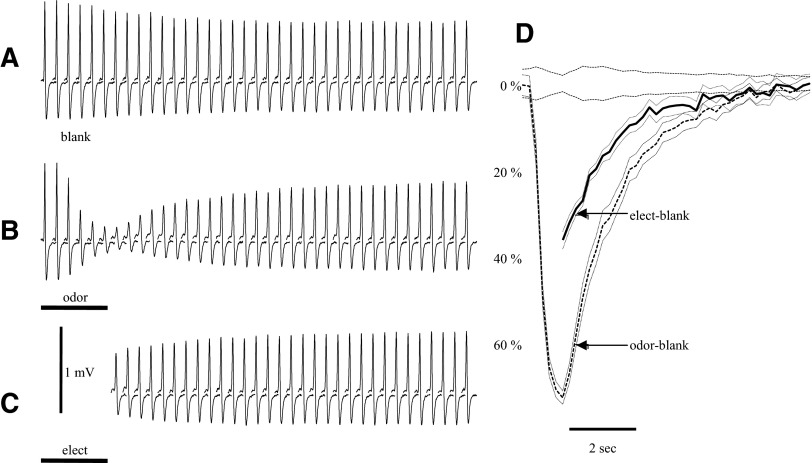
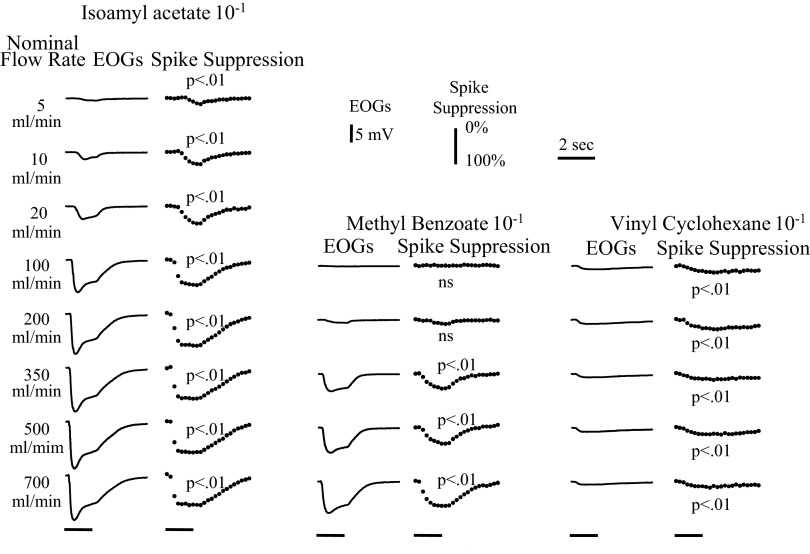
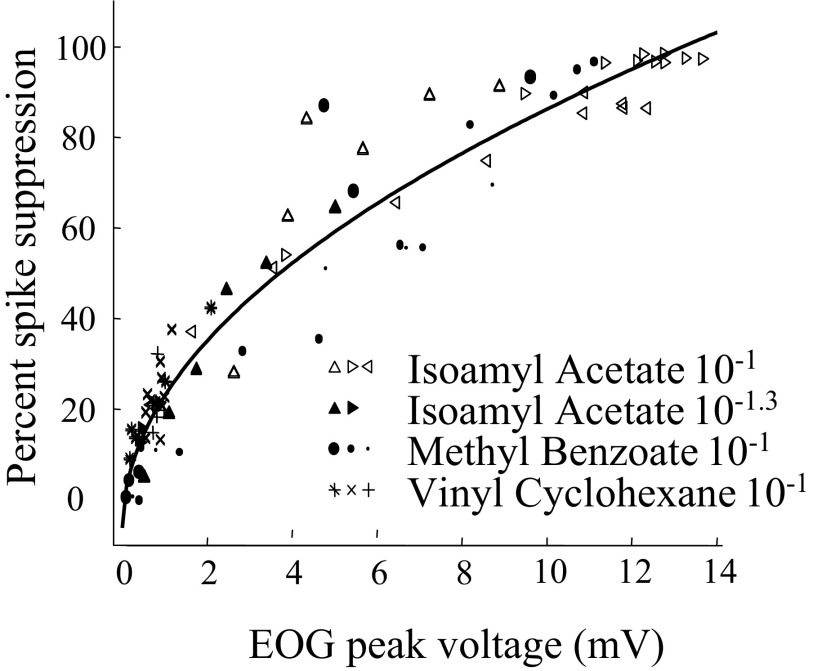
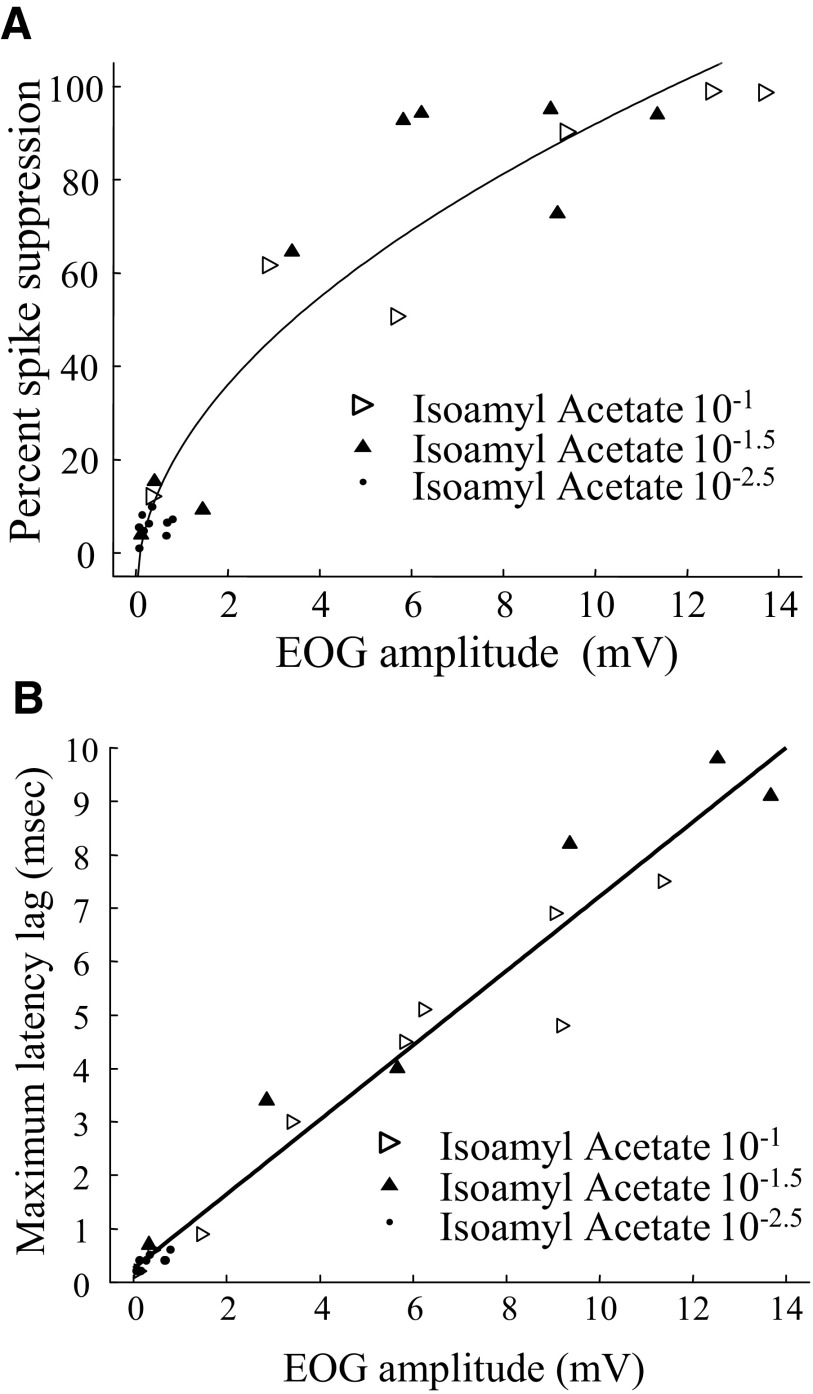
Spikes were evoked in rat olfactory sensory neuron (OSN) populations by electrical stimulation of the olfactory bulb nerve layer in pentobarbital anesthetized rats. The latencies and recording positions for these compound spikes showed that they originated in olfactory epithelium. Dual simultaneous recordings indicated conduction velocities in the C-fiber range, around 0.5 m/s. These spikes are concluded to arise from antidromically activated olfactory sensory neurons. Electrical stimulation at 5 Hz was used to track changes in the size and latency of the antidromic compound population spike during the odor response. Strong odorant stimuli suppressed the spike size and prolonged its latency. The latency was prolonged throughout long odor stimuli, indicating continued activation of olfactory receptor neuron axons. The amounts of spike suppression and latency change were strongly correlated with the electroolfactogram (EOG) peak size evoked at the same site across odorants and across stimulus intensities. We conclude that the curve of antidromic spike suppression gives a reasonable representation of spiking activity in olfactory sensory neurons driven by odorants and that the correlation of peak spike suppression with the peak EOG shows the accuracy of the EOG as an estimate of intracellular potential in the population of olfactory sensory neurons. In addition, these results have important implications about traffic in olfactory nerve bundles. We did not observe multiple peaks corresponding to stimulated and unstimulated receptor neurons. This suggests synchronization of spikes in olfactory nerve, perhaps by ephaptic interactions. The long-lasting effect on spike latency shows that action potentials continue in the nerve throughout the duration of an odor stimulus in spite of many reports of depolarization block in olfactory receptor neuron cell bodies. Finally, strong odor stimulation caused almost complete block of antidromic spikes. This indicates that a very large proportion of olfactory axons was activated by single strong odor stimuli.


Figures

FIG. 1.
FIG. 1.
A: the averages of 6 sweeps for antidromic spikes recorded simultaneously from sites in the dorsal and lateral parts of olfactory epithelium during stimulation with electrodes at dorsal and lateral sites on the olfactory bulb surface. With dorsal bulb stimulation (100 V for 3 ms), the spike response was only detectable in the dorsal epithelium, whereas lateral bulb stimulation (100 V for 2 ms) evoked a response only in the lateral epithelium. The shock artifact is removed for the dorsal recordings to avoid overlap of the records. All records are from the same animal. B: simultaneous recordings from 2 dorsal sites in a different animal (average of 8 sweeps). The latencies from the beginning of the stimulus pulse for the 2 spike peaks are 22.5 ± 0.03 and 26.6 ± 0.10 (SE) ms. The recording electrodes were 3.1 mm apart, giving a conduction velocity of 0.67 M/s.
FIG. 2.
FIG. 2.
The response of a spike recorded in the dorsal epithelium after paired pulses with a 6.6-ms interval (150 Hz). The 2 spikes show that the response follows high frequencies. Average of 8 sweeps. The onset of the 2 stimulus pulses is shown by the 2 dots above the records.
FIG. 3.
FIG. 3.
A: change in antidromic spike latency with repetitive stimulation at 30 Hz for 2 recording sites in the dorsal epithelium. The change is represented as differences from the 1st response (based on averages of 10 sweeps). The circles represent the more anterior site, and the dots represent the more posterior site. The difference is greater for the site more distance from the stimulus. B: change in spike size with repetition. Note that the spike size increased for the 2nd through the 4th pulses and decreased sharply. The anterior site is slightly more affected by prolonged repetition. The measurements are based on the average of 10 sweeps. C: spike size decreased in a nearly linear fashion after the 1st few stimuli of the train, although after prolonged stimulation, the spike size changed more slowly than the spike latency. The form of this curve was similar for the 2 sites.
FIG. 4.
FIG. 4.
The antidromic spikes at the dorsal sites were suppressed if the stimuli were applied during strong odor stimulation. Responses to a train of electrical stimulation without odor are compared with response during odor presentation. Electrical stimuli to the bulb surface were presented at a rate of 5/s. A: average responses to the electrical stimulus for a blank (n = 5). Arrows indicate the time of the electrical stimuli (stimulus artifacts removed). B: a 1.5-s presentation of methyl benzoate (10−1 of saturation) depressed the size of the averaged antidromic spikes (n = 5 odor stimuli). The traces in A and B are truncated before the end of the recording. Both the electroolfactogram (EOG) and the spike height returned to baseline by the end of the 4-s recording. C: spikes 1, 3, and 10 from B. Because the EOG and the decay after the shock could distort measurements of the peak, the peak measurements were made from a baseline estimate (dotted line) based on a fit to the points before and after the spike (heavy line). D: control spikes of A with the estimated baseline subtracted. With repeated shocks in a train, the peak latency (indicated by circles) shifts slightly relative to the peak latency of the 1st spike (dotted vertical line). The spikes also broaden during repeated stimuli as shown by the increased latency of the minimum voltage after the peak (filled circles). E: the spikes during the odor response with the estimated baseline subtracted (as in B). The peaks and minimums of the spikes are indicated with open and filled circles as in D. The amplitudes of spikes in the blank and odor trials were calculated as the difference in voltage between the peak and the minimum, as shown for trials 1, 9, and 15. The percent spike suppression was calculated from the ratio of the amplitudes in the odor/blank trails, as shown to the right of E. The statistical significance of differences in spike amplitude was assessed with t-test. In this example, there were 5 blank and 5 odor trials. *Times at which the spike suppression was significant at the P < 0.01 level.
FIG. 5.
FIG. 5.
Antidromic spikes during the odor responses have a single peak. A: overlapped spikes similar to those of Fig. 4E aligned on the electrical stimulus. Each successive spike after the 1st 2 had a smaller size and a longer latency. The arrows indicate spikes 4 and 8 of the sequence (heavy solid lines). The absence of a short latency peak for later spikes in the sequence indicates that there were not 2 modal spike latencies. B: the same data aligned on the spike peaks and indicates that there was some broadening of the spike at longer latencies, which could represent either slight asynchrony of the spikes or slowing of the action potentials.
FIG. 6.
FIG. 6.
Spike suppression during odor responses is greater than would be expected from the antidromic latency. A: EOG record from Fig. 4 (solid line) and plots the spike suppression computed for each successive antidromic spike in the sequence (numbers). The key for spike suppression is at the right. B: antidromic spikes during the blank and odor stimulus against the corresponding spike latency as in Fig. 3C. For the blank, the individual responses for the 5 repetitions are plotted as filled circles bordered by a dotted line indicating the SD. The solid line extended from those points is an estimate of the latency-size relationship based on a higher frequency test at the same recording site. The spikes during the odor response are marked with the same numbers as in A and are connected by lines to help clarify the sequence.
FIG. 7.
FIG. 7.
The latency of spikes is increased during odor response in proportion to axon length. A: latencies of simultaneously recorded spikes in the dorsal epithelium. The more anterior site (squares) had a longer latency. B: latency changes during responses to 2 concentrations of isoamyl acetate odorant presentation. The spike with the longer latency showed a consistently greater increase in latency during the odor response. Measurements based on the average of 5 sweeps.
FIG. 8.
FIG. 8.
The effect of odor stimulation on antidromic spike latency (x) lasts as long as the odor stimulus and the spike suppression (filled circles). This implies that the odor stimulus continues to evoke action potentials in the nerve.
FIG. 9.
FIG. 9.
The slow decay of response suppression does not necessarily represent continued activity in olfactory nerve. On the left are overlapped insets of average antidromic spikes recorded in different conditions. A: responses during a blank (25 sweeps). B: response from the same site during odor stimulation with isoamyl acetate (25 sweeps). C: recovery after a train of high-frequency antidromic shocks (37 Hz) that depressed the spike size (22 sweeps). Measurements during the high-frequency train were not possible because the shocks overlapped the spike. All test stimuli are at 200-ms intervals. D: mean and SE for the spike suppression curves vs. the SE around the 0 line for the blanks. The values of the suppression ratio are indicated by the scale at the left. Both odor and electrical responses decay very slowly.
FIG. 10.
FIG. 10.
The average EOGs and corresponding spike suppression records are plotted for 3 odorants at a series flow rates from a single animal. All records have the same time base. All responses were all evoked by 1.5-s odor stimuli, indicated by the bars at the bottom of the figure. The calibration for the EOGs and spike suppression plots are shown in the top right. Significance tests for the spike suppression records were one-tailed t-tests with a criterion of P < 0.01 for the sums of the degree of suppression against the corresponding blank records.
FIG. 11.
FIG. 11.
Peak EOG and peak spike suppression from 3 experiments. The fitted line is −0.06 + 0.3 × sqrt (EOG). The correlation with the fitted line is 0.97 and the linear correlation is 0.94. The relationship seems independent of the odor.
FIG. 12.
FIG. 12.
A: results from an experiment in which response size was manipulated by varying both flow rate and isoamyl acetate concentration. The result is very similar to that of Fig. 9. The fitted line is −0.09 + 0.32 × sqrt(EOG). The correlation for the fitted line is 0.95 and the linear correlation is 0.92. The nonlinearity occurs because the spike suppression ratio cannot go beyond 100%. However, some of the response did approach 100% spike suppressio. B: spike latency data from the same experiment as Fig. 10 showing that the spike latencies are also very sensitive to odor stimulation. In this case the relationship is clearly linear.

Similar articles

Cited by

References

    1. Astic L, Saucier D, Holley A. Topographical relationships between olfactory receptor cells and glomerular foci in the rat olfactory bulb. Brain Res 424: 144–152, 1987. - PubMed
    1. Belluscio L, Gold GH, Nemes A, Axel R. Mice deficient in G(olf) are anosmic. Neuron 20: 69–81, 1998. - PubMed
    1. Bliss TV, Rosenberg ME. Activity-dependent changes in conduction velocity in the olfactory nerve of the tortoise. Pfluegers 381: 209–216, 1979. - PubMed
    1. Bokil H, Laaris N, Blinder K, Ennis M, Keller A. Ephaptic interactions in the mammalian olfactory system. J Neurosci 21: RC173, 2001. - PMC - PubMed
    1. Brunet LJ, Gold GH, Ngai J. General anosmia caused by a targeted disruption of the mouse olfactory cyclic nucleotide-gated cation channel. Neuron 17: 681–693, 1996. - PubMed

Publication types

LinkOut - more resources