. 2008 Dec;19(12):5259-66.
doi: 10.1091/mbc.e08-06-0622. Epub 2008 Oct 8.

Posttranslational regulation of the scaffold for Fe-S cluster biogenesis, Isu

Affiliations

Posttranslational regulation of the scaffold for Fe-S cluster biogenesis, Isu

Amy J Andrew et al. Mol Biol Cell. 2008 Dec.

Abstract

Isu, the scaffold protein on which Fe-S clusters are built in the mitochondrial matrix, plays a central role in the biogenesis of Fe-S cluster proteins. We report that the reduction in the activity of several components of the cluster biogenesis system, including the specialized Hsp70 Ssq1, causes a 15-20-fold up-regulation of Isu. This up-regulation results from changes at both the transcriptional and posttranslational level: an increase in ISU mRNA levels and in stability of ISU protein. Its biological importance is demonstrated by the fact that cells lacking Ssq1 grow poorly when Isu levels are prevented from rising above those found in wild-type cells. Of the biogenesis factors tested, Nfs1, the sulfur donor, was unique. Little increase in Isu levels occurred when Nfs1 was depleted. However, its presence was required for the up-regulation caused by reduction in activity of other components. Our results are consistent with the existence of a mechanism to increase the stability of Isu, and thus its level, that is dependent on the presence of the cysteine desulfurase Nfs1.


Figures

Figure 1.
Figure 1.
Comparison of ISU1 and ISU2 protein and mRNA levels. (A) Expression of Isu1 and Isu2. Purified Isu1pstrep or Isu2pstrep, 5 ng of both, (left lanes) or 0.1 OD600 units of whole cell lysates from the indicated strains (right lanes) were subjected to electrophoresis and immunoblot analysis with Isu-specific antibodies or as a control Mge1-specific antibodies. WT, wild type. (B) Equivalent amounts of total cellular RNA isolated from the indicated yeast strains were separated by electrophoresis, blotted to a membrane, and subjected to hybridization with probes encompassing the ORFs of ISU1, ISU2 and, as a control, PGK1.
Figure 2.
Figure 2.
Effect of absence of Aft1 and Aft2 on ssq1Δ cells. (A) Serial dilutions at 1:10 of the indicated strains were spotted onto glucose-rich medium, and the plate was incubated for 3 d at 30°C. WT, wild type. (B) Dilutions at 1:10 of the indicated strains were spotted onto glucose-rich medium containing 120 μM BPS, and the plate was incubated for 3 d at 30°C. (C) Cell extracts from indicated strains were separated by SDS-PAGE and subjected to immunoblot analysis with Isu-specific antibodies, or, as a loading control, Mge1-spcific antibodies. (D) Total RNA extracted from the indicated yeast strains were analyzed by Northern blots using probes for the ORFs of ISU1, ISU2, and as a control, PGK1.
Figure 3.
Figure 3.
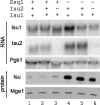
Isu is regulated at the posttranscriptional level. Equivalent amounts of total mRNA (top panels) or cell extracts (bottom panels) from the indicated yeast strains lacking AFT1 were subjected to separation by electrophoresis, blotted to membranes, and analyzed by hybridization using probes for the ORFs of ISU1, ISU2 and, as a control, PGK1 in the case of RNA or using Isu-specific antibody and, as a loading control, Mge1-specific antibody for immunoblot analysis. The presence of the wild-type gene is indicated by (+), absence of the gene by (−); The asterisk refers to ISU1* in which the Aft consensus binding site has been altered as described in the text.
Figure 4.
Figure 4.
Synthesis and degradation of Isu1 in the presence and absence of SSQ1. Cells were pulse-labeled for 2 min at 30°C by addition of 35S-labeled amino acids, and samples were removed and subjected to immunoprecipitation and analysis as described in Material and Methods. When indicated, a chase was initiated by addition of unlabeled amino acids (0 time). (A) Inset, analysis of rate of protein synthesis of two independent control aft1Δ isu2Δ ISU1* WT and four experimental ssq1Δaft1Δ isu2Δ ISU1* (ssq1Δ), carried out in duplicate. Incorporation by control cells into Isu1 was arbitrarily set at 1, with the resulting values being 1.0 ± 0.2 and for ssq1Δ, 1.3 ± 0.3. (A–C) Pulse-chase analysis of rates of degradation. Calculated t1/2 is indicated in minutes (e.g., 21′). (A and C) Isu1 or (B) Ssc1, as a control. Level at 0 time was set as 100%. Data were fit using SigmaPlot to a single two-parameter exponential decay (y = ae−bx). Strains analyzed. WT: aft1Δ isu2Δ ISU1* (●); ssq1Δ: ssq1Δ aft1Δ isu2Δ ISU1* (○); Isu-up: aft1Δ isu1Δ isu2Δ tetR-ISU1 (▼). (C) Inset, extracts from indicated strains were subjected to immunoblot analysis using Isu-specific antibodies.
Figure 5.
Figure 5.
Expression of Isu1 in the absence of Ssq1. Cell extracts were prepared from strains having the aft1Δ isu2Δ mutation, in addition to the indicated genetic alterations. As indicated by the line, four independent transformants were analyzed. Each had the isu1Δ mutation on the chromosome and harbored a plasmid carrying the ISU1 gene under the control of the tetR promoter (tetR-ISU1). When indicated, doxycycline (Dox) was added (+) to 2 μg/ml. Extracts were separated by electrophoresis and subjected to immunoblot analysis with Isu-specific antibody, and as a loading control Ssc1-specific antibody. The doubling times for the strains in hours (h) are indicated at the bottom.
Figure 6.
Figure 6.
Level of components of Fe-S cluster biogenesis system in the absence of Ssq1. Equivalent amounts of mitochondrial extracts prepared from wild-type and ssq1Δ cells were separated by SDS-PAGE and probed with polyclonal antibodies specific for the indicated proteins.
Figure 7.
Figure 7.
Effect of reduced activity of components of the Fe-S biogenesis system on Isu levels. (A) Cell lysates, prepared from indicated strains, were separated by SDS-PAGE and subjected to immunoblot analysis with Isu-specific and, as a loading control, Mge1-specific antibody. The Isu blot was exposed for 2 min (long) to visualize Isu in the wild-type strain and for 15 s (short) to allow comparison of levels of Isu in the high expressing strains. (B) FET3-lacZ reporter activation was measured in jac1Δ harboring wild-type JAC1 (WT) or jac1LKDDEQ (M) on a plasmid; nfs1Δ harboring NFS1 (WT) or nfs1I191S (M) on a plasmid. β-Galactosidase activities of samples from multiple transformants of indicated strains are shown. (C) Pulse-chase analysis of Isu1 degradation in isu2Δ jac1LKDDEQ compared with the control isu2Δ expressing wild-type JAC1. Calculated t1/2 is indicated in minutes (e.g., 36′). The level at 0 time was set as 100%. Data were fit using SigmaPlot to a single two-parameter exponential decay (y = ae−bx).
Figure 8.
Figure 8.
Effect of Nfs1 depletion on Isu expression. (A) GAL-JAC1 (top) and GAL-NFS1 (bottom) were grown in galactose-based medium and then shifted to glucose-based medium at zero time. Because expression of both Jac1 and Nfs1 were expressed above normal levels from the GAL1 promoter, samples were taken as the level of these proteins approached normal (at 16 h in the case of Jac1 repression; 8 h in the case of Nfs1 repression). Crude mitochondrial extracts were prepared and analyzed as in A using antibodies specific for Isu, Jac1, or Nfs1. The signal was quantified after immunoblot analysis using antibodies specific for Isu, Jac1, or Nfs1. (B) Wild type, jac1LKDDEQ, and GAL-NFS1 jac1LKDDEQ cells were shifted from galactose- to glucose-based medium at zero time. Cells were harvested at the indicated times, and mitochondrial extracts were prepared and analyzed by immunoblots using antibodies specific for Isu and as a control, Mge1.

References

    1. Aloria K, Schilke B., Andrew A., Craig E. Iron-induced oligomerization of yeast frataxin homologue Yfh1 is dispensable in vivo. EMBO Rep. 2004;5:1096–1101. - PMC - PubMed
    1. Andrew A. J., Dutkiewicz R., Knieszner H., Craig E. A., Marszalek J. Characterization of the interaction between the J-protein Jac1p and the scaffold for Fe-S cluster biogenesis, Isu1p. J. Biol. Chem. 2006;281:14580–14587. - PubMed
    1. Ausubel F., Brent R., Kingston R., Moore D., Seidman J. G., Smith J., Struhl K. Current Protocols in Molecular Biology. New York: John Wiley & Sons; 1997.
    1. Barras F., Loiseau L., Py B. How Escherichia coli and Saccharomyces cerevisiae build Fe/S proteins. Adv. Microb. Physiol. 2005;50:41–101. - PubMed
    1. Burns N., Grimwade B., Ross-Macdonald P. B., Choi E. Y., Finberg K., Roeder G. S., Snyder M. Large-scale analysis of gene expression, protein localization, and gene disruption in Saccharomyces cerevisiae. Genes Dev. 1994;8:1087–1105. - PubMed

Publication types

MeSH terms

LinkOut - more resources