. 2008 Oct 14;105(41):16039-44.
doi: 10.1073/pnas.0807010105. Epub 2008 Oct 8.

Electrophysiological correlates of the brain's intrinsic large-scale functional architecture

Affiliations

Electrophysiological correlates of the brain's intrinsic large-scale functional architecture

Biyu J He et al. Proc Natl Acad Sci U S A. .

Abstract

Spontaneous fluctuations in the blood-oxygen-level-dependent (BOLD) signals demonstrate consistent temporal correlations within large-scale brain networks associated with different functions. The neurophysiological correlates of this phenomenon remain elusive. Here, we show in humans that the slow cortical potentials recorded by electrocorticography demonstrate a correlation structure similar to that of spontaneous BOLD fluctuations across wakefulness, slow-wave sleep, and rapid-eye-movement sleep. Gamma frequency power also showed a similar correlation structure but only during wakefulness and rapid-eye-movement sleep. Our results provide an important bridge between the large-scale brain networks readily revealed by spontaneous BOLD signals and their underlying neurophysiology.


Conflict of interest statement

The authors declare no conflict of interest.

Figures
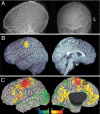
Fig. 1.
Fig. 1.
Spatial topography of electrode coverage and sensorimotor network in Patient 1. (A) Radiograph showing electrode placements. (B) Three-dimensional rendering of anatomical MRI and projection of electrode locations onto the three-dimensional surface. Clinical mapping of the sensorimotor cortex is indicated by color patches. Red indicates hand motor area based on median nerve somatosensory evoked potential (SSEP); yellow indicates hand sensory area based on SSEP; blue indicates facial twitching in response to cortical stimulation; and green indicates hand grasp in response to cortical stimulation. (C) BOLD sensorimotor correlation map (Z-score, thresholded at P < 0.05, corrected for multiple comparisons) and electrode locations overlaid on the pial surface reconstructed from anatomical MRI. Two bad electrodes in the anterior temporal strip were eliminated. Four sensorimotor ROIs (delineated by magenta contours) and four control ROIs (blue contours) were determined in this patient. The cross-hatching indicates the epileptogenic zone that was subsequently resected.
Fig. 2.
Fig. 2.
ROI-pair cross-correlations computed using ECoG and BOLD signals. (A) Patient 1: lagged cross-correlation functions were computed by using ECoG signal filtered in eight frequency bands for all possible sensorimotor (SM)-SM (n = 6) and SM-control (C) (n = 16) ROI pairs. ROI pairs of similar type were averaged together after Fisher's r-to-z transformation. Red hues indicate SM-SM, and blue/green hues indicate SM-C. (B) Patient 1: BOLD lagged cross-correlation functions were averaged separately for SM-SM (red) and SM-C (blue) ROI pairs. (C) Combining data over all patients: peak ECoG cross-correlation values (within ± 500-ms lag) as a function of ROI-pair type (SM-SM vs. SM-C) and arousal state (awake, SWS, and REM). Two-way ANOVA yielded a highly significant main effect of ROI-pair type (<0.5 Hz: F1,47 = 20.1, P < 0.0001; 1–4 Hz: F1,47 = 17.8, P = 0.0001). Neither the effect of arousal state nor the interaction of ROI-pair type × arousal state was significant (P > 0.1). All error bars denote SEM.
Fig. 3.
Fig. 3.
Effect of inter-ROI distance on ECoG peak cross-correlation values (within lag of ± 500 ms). (Left) <0.5-Hz band. (Right) 1–4-Hz band. ECoG data were from the waking state. Each ROI pair is represented by one symbol. ● indicates sensorimotor-sensorimotor ROI pair. ◇ indicates sensorimotor-control ROI pair.
Fig. 4.
Fig. 4.
BOLD vs. ECoG cross-correlation function peak values. Peak correlations of filtered (<0.5 Hz and 1–4 Hz) ECoG activity were evaluated for lags in the range ± 500 ms. Peak correlations of BOLD and γ-BLP (both sampled at 2-s interval) were evaluated at zero-lag. Each ROI pair is represented by one symbol. All sensorimotor-sensorimotor and sensorimotor-control ROI pairs from all patients are shown. In Patient 2, the ECoG derivation was modified Laplacian; in all other patients, it was average reference. (A) <0.5-Hz ECoG. (B) 1–4-Hz EcoG. (C) γ-BLP EcoG. P values represent the significance of the measured correlation between BOLD and ECoG peak correlations.
Fig. 5.
Fig. 5.
Similarity of BOLD and ECoG (<0.5-Hz band) correlation structures assessed by spatial correlation and eigenvector decomposition strategies in Patient 1. (A) Raw representative BOLD and ECoG (<0.5 Hz) correlation maps that were used for spatial correlation analyses. Each dot represents one electrode. The arrow points to the seed electrode. Color represents Fisher's z-transformed correlation value between each electrode and the seed electrode, computed by using BOLD signal or <0.5-Hz ECoG signal from each arousal state. BOLD correlation maps were spatially sampled by the electrode coverage to compare with ECoG correlation maps. The maps in the top row seed at a same sensorimotor (SM) electrode, and those in the bottom row seed at a control (C) electrode. Note that these two seed electrodes are separated only by 2 cm. A, anterior; D, dorsal; P, posterior; V, ventral. This two-dimensional presentation of the electrode grid was extrapolated from Fig. 1. (B) Statistical results of spatial correlation analysis. Spatial correlations were computed between two BOLD correlation maps (BOLD:BOLD), between two ECoG correlation maps (ECoG:ECoG), or between a BOLD correlation map and an ECoG correlation map (BOLD:ECoG). Each bar represents the mean spatial correlation averaged over seed-electrode pairs. SM-C indicates that one correlation map was obtained by seeding at an SM electrode and the other map by seeding at a C electrode. SM-SM indicates that both maps were obtained by seeding at an SM electrode. Error bars denote SEM. ***: significant nonzero mean spatial correlation (P < 0.0001; one-sample t test). The over-bracketed P values indicate unpaired t tests comparing seed electrodes within (SM-SM) vs. across (SM-C) functional systems. ECoG data were from the waking state. Comparable results were obtained in all patients and for ECoG data from all states of arousal (Fig. S6). (C) Eigenvector decomposition analysis comparing BOLD and ECoG (from all three states) covariance structures. The ordinate shows the fraction of ECoG variance captured by eigenvectors derived by diagonalization of the BOLD covariance matrix. These eigenvectors were sorted by the rank-ordering of their corresponding eigenvalues (index shown in the abscissa), such that the eigenvector with the smallest index was associated with the largest eigenvalue, and hence accounted for the most variance in the BOLD data. The variable range of the abscissa reflects the number of eigenvectors, which is the same as the number of usable electrodes in each patient. The decreasing trend of the plot indicates that eigenvectors accounting for more BOLD variance also accounted for more ECoG variance. The statistical significance of the covariance structure similarity (tested by Spearman rank order correlation) is listed in the key. Comparable results were obtained in all patients (Fig. S8).

Comment in

  • A BOLD window into brain waves.
    Balduzzi D, Riedner BA, Tononi G. Balduzzi D, et al. Proc Natl Acad Sci U S A. 2008 Oct 14;105(41):15641-2. doi: 10.1073/pnas.0808310105. Epub 2008 Oct 8. Proc Natl Acad Sci U S A. 2008. PMID: 18843102 Free PMC article. No abstract available.

References

    1. Biswal B, Yetkin FZ, Haughton VM, Hyde JS. Functional connectivity in the motor cortex of resting human brain using echo-planar MRI. Magn Reson Med. 1995;34:537–541. - PubMed
    1. Vincent JL, et al. Intrinsic functional architecture in the anaesthetized monkey brain. Nature. 2007;447:83–86. - PubMed
    1. Hampson M, Peterson BS, Skudlarski P, Gatenby JC, Gore JC. Detection of functional connectivity using temporal correlations in MR images. Hum Brain Mapp. 2002;15:247–262. - PMC - PubMed
    1. Fox MD, Corbetta M, Snyder AZ, Vincent JL, Raichle ME. Spontaneous neuronal activity distinguishes human dorsal and ventral attention systems. Proc Natl Acad Sci USA. 2006;103:10046–10051. - PMC - PubMed
    1. Seeley WW, et al. Dissociable intrinsic connectivity networks for salience processing and executive control. J Neurosci. 2007;27:2349–2356. - PMC - PubMed

Publication types