Review
. 2008 Sep;28(4):395-406.
doi: 10.1055/s-0028-1083697. Epub 2008 Oct 8.

Magnetic resonance imaging techniques: fMRI, DWI, and PWI

Affiliations
Review

Magnetic resonance imaging techniques: fMRI, DWI, and PWI

Samantha J Holdsworth et al. Semin Neurol. 2008 Sep.

Abstract

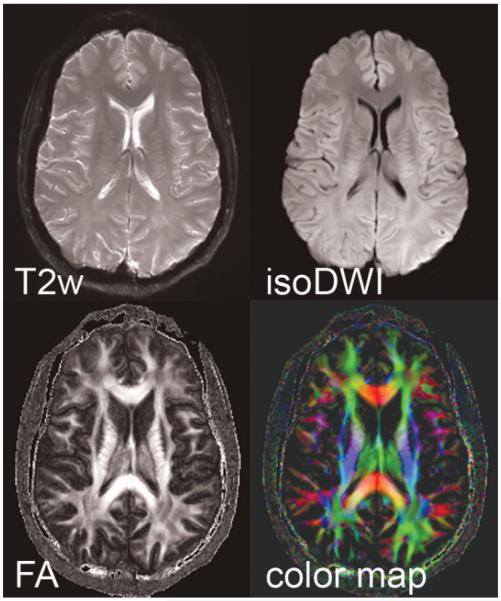
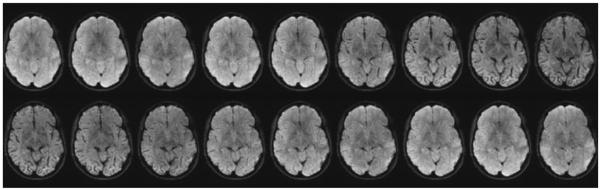
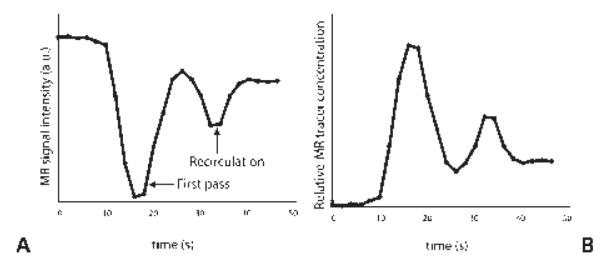
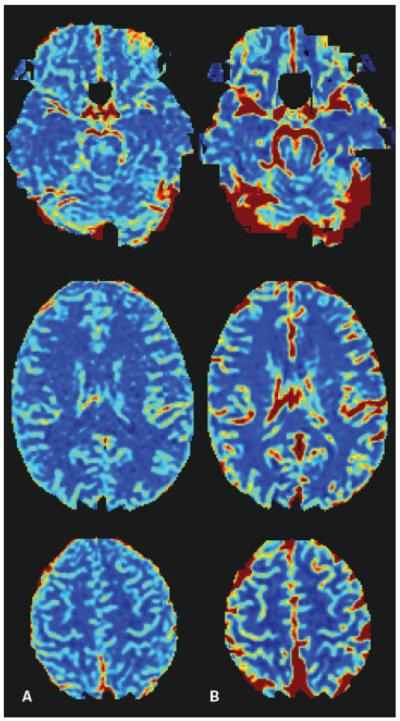
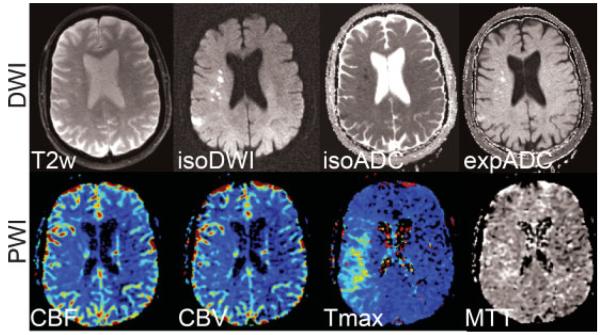
Magnetic resonance imaging (MRI) is a noninvasive technique which can acquire important quantitative and anatomical information from an individual in any plane or volume at comparatively high resolution. Over the past several years, developments in scanner hardware and software have enabled the acquisition of fast MRI imaging, proving extremely useful in various clinical and research applications such as in brain mapping or functional MRI (fMRI), perfusion-weighted imaging (PWI), and diffusion-weighted imaging (DWI). These techniques have revolutionized the use of MRI in the clinics, providing great insight into physiologic mechanisms and pathologic conditions. Since these relatively new areas of MRI have relied on fast scanning techniques, they have only recently been widely introduced to clinical sites. As such, this review article is devoted to the technological aspects of these techniques, as well as their roles and limitations in neuroimaging applications.


Figures

Figure 1
Figure 1
A typical echo planar pulse sequence timing diagram (EPI) from (A) a gradient echo and (B) a spin echo RF excitation. (C) Resulting imaging data, otherwise known as the EPI“ k-space trajectory.” The gradients in Gz are the slice-select gradients. In the readout direction (Gx), the gradients oscillate rapidly between positive and negative values, corresponding to moving in opposite directions along the kx-axis. A strong “blip” in Gy (the phase-encoding direction) moves the k-space trajectory from one line to the next. Thus the whole of k-space (corresponding to one complete image) is filled in one repetition (TR). TE is the echo time, determined by the distance from the middle of the 90-degree RF pulse to the center of the largest echo (i.e., the center of k-space). RF, radiofrequency.
Figure 2
Figure 2
fMRI processing. (A) A usual fMRI experiment is conducted by alternating between two states (A, B); for example, stimulation on/off. (B) The tissue response follows the stimulation pattern determined by the hemodynamic response function. In the activated state B, the fMRI signal increases due to the prolonged T2* time. (C) A combination of the images from states A and B leads to (D) an image that demonstrates contrast in areas where functional activation occurred. For better localization, the activation results can be overlaid onto a morphologic reference image. This allows investigators to determine gray and white matter boundaries precisely as well as to delineate activated and nonactivated borders. fMRI, functional magnetic resonance imaging.
Figure 3
Figure 3
fMRI performed at 1.5T. The stimulus is a block design with simultaneous left-hand finger tapping and movement of the tongue. (A) Activation in the sensory (S1) and motor (M1) cortical regions from the left-hand finger tapping. (B) Bilateral activation from the tongue movements. (C) Activation of the vermis, a brain structure involved in motor control (anatomically corresponding to the Broca’s area). fMRI, functional magnetic resonance imaging. (Images courtesy of Anders Nordell, Karolinska Institute, Stockholm, Sweden.)
Figure 4
Figure 4
Acute ischemic stroke of a 73-year-old male patient. Top row: Approximately 1.5 to 2 hours after onset of clinical symptoms, conventional x-ray CT shows no clear signs of infarction. Bottom row: Series of DWIs obtained immediately after CT examination allows exact delineation of injured tissue. DWI examination was performed with a navigated diffusion-weighted multi-shot echo planar imaging sequence (b = 1000 second mm2). The CT scan took 5.6 seconds and the DWI took 45 seconds. DWI, diffusion-weighted image; CT, computed tomography.
Figure 5
Figure 5
Visualization of proton displacement front due to diffusion. (A) Isotropic diffusion occurs if diffusion is equal along all directions. (B) For the same diffusion observation time interval the proton displacement front is smaller in the presence of reduced diffusion. (C,D) With the introduction of diffusion barriers, diffusion is anisotropic, and differs along different directions.
Figure 6
Figure 6
Single-shot diffusion-weighted spin echo EPI pulse sequence. Diffusion-weighting gradients of strength GD, duration δ, and spacing Δ are applied during each TE/2 period. The diffusion-weighted echo is sampled at the time t = TE when the spin echo is formed. The diffusion attenuation is dependent on the parameters GD, δ, and Δ. The entire k-space is filled with a single EPI-readout train. EPI, echo planar imaging; RF, radiofrequency, Gx, readout direction; Gy, phase-encode direction; Gz, slice select direction; TE, echo time; TR, repetition time.
Figure 7
Figure 7
DWIs with diffusion encoding along the (A) left-right, (B) anterior-posterior, and (C) craniocaudal direction. Notice that white matter fibers running perpendicular to the gradient direction appear to be hyperintense because of lower values of diffusivity, whereas fibers running in parallel to the gradient direction demonstrate lower signal intensities. The average of the three images produces the isotropic DWI shown on the right. DWI, diffusion-weighted image.
Figure 8
Figure 8
Comparison between conventional diffusion-weighted (b = 1000 second mm2) single-shot EPI at 1.5T without (left) and with (right) acceleration in patient with strokes located in the brainstem (open arrows). The latter used a parallel imaging acceleration factor of 3. By means of the faster k-space traversal with parallel imaging the distortion and blurring artifacts from field-inhomogeneities are markedly diminished (closed arrows). Temporal brain tissue exhibits significantly reduced distortions and signal loss with the use of parallel imaging. EPI, echo planar image.
Figure 9
Figure 9
Parallel-driven EPI datasets acquired at 3T with an acceleration factor of 3, a target resolution of 288 × 288, three b = 0 second mm2 (T2w) and 15 directions with b = 1000 second mm2, in a scan time of 19 minutes. The isotropic diffusion image (isoDWI) is shown, as well as the fractional anisotropy (FA), and corresponding color map. EPI, echo planar image.
Figure 10
Figure 10
Dynamic susceptibility contrast imaging. Time course of the T2*-weighted MR images during contrast material bolus passage. Due to the high concentration of contrast material the signal intensity decreases significantly during the peak of the bolus. (Image courtesy of Rexford Newbould, GSK, London, UK.)
Figure 11
Figure 11
(A) Plot of the signal from a T2*-weighted sequence after injection of a contrast bolus as it travels through a region of interest in the brain. In (B), the signal is converted to concentration versus time.
Figure 12
Figure 12
Cerebral blood flow color maps calculated from (A) spin echo, and (B) gradient echo T2*-weighted sequence. Note the great vessel contrast in the gradient echo images, and the increased levels of distortion in the frontal lobe.
Figure 13
Figure 13
Acute stroke patient with a clear DWI-PWI mismatch pattern in the right MCA territory. (Top row) Diffusion-weighted images (b = 1000 second mm2) showing the T2-weighted (b = 0) image, isotropic DWI (isoDWI) and ADC (isoADC). The exponential ADC (expADC) is the ratio of the isoDWI to the T2, which may be used to distinguish acute from subacute stroke as it eliminates “T2-shine through” effects. (Bottom row) CBV, CBF, Tmax, and MTT maps. The area of perfusion deficit is clearly apparent in the Tmax and MTT images. Although present, the ischemic area is less apparent on the CBF and CBV maps. DWI, diffusion-weighted imaging; PWI, perfusion-weighted imaging; MCA, middle cerebral artery; ADC, apparent diffusion coefficient; CBV, cerebral blood volume; CBF, cerebral blood flow; Tmax, time to peak of the residue function; MTT, mean transit time.

Similar articles

Cited by

References

    1. Ogawa S, Lee TM, Nayak AS, Glynn P. Oxygenation-sensitive contrast in magnetic resonance image of rodent brain at high magnetic fields. Magn Reson Med. 1990;14:68–78. - PubMed
    1. Crank J. The Mathematics of Diffusion. Oxford University Press; New York, NY: 1956.
    1. Basser PJ, Mattiello J, LeBihan D. Estimation of the effective self-diffusion tensor from the NMR spin echo. J Magn Reson B. 1994;103:247–254. - PubMed
    1. Basser PJ. Inferring microstructural features and the physiological state of tissues from diffusion-weighted images. NMR Biomed. 1995;8(7–8):333–344. - PubMed
    1. Moseley ME, Kucharczyk J, Mintorovitch J, et al. Diffusion-weighted MR imaging of acute stroke: correlation with T2-weighted and magnetic susceptibility-enhanced MR imaging in cats. AJNR Am J Neuroradiol. 1990;11:423–429. - PMC - PubMed

Publication types