Review
. 2008 Dec;14(4):321-40.
doi: 10.1089/ten.teb.2008.0248.

Optical spectroscopy and imaging for the noninvasive evaluation of engineered tissues

Affiliations
Review

Optical spectroscopy and imaging for the noninvasive evaluation of engineered tissues

Irene Georgakoudi et al. Tissue Eng Part B Rev. 2008 Dec.

Abstract

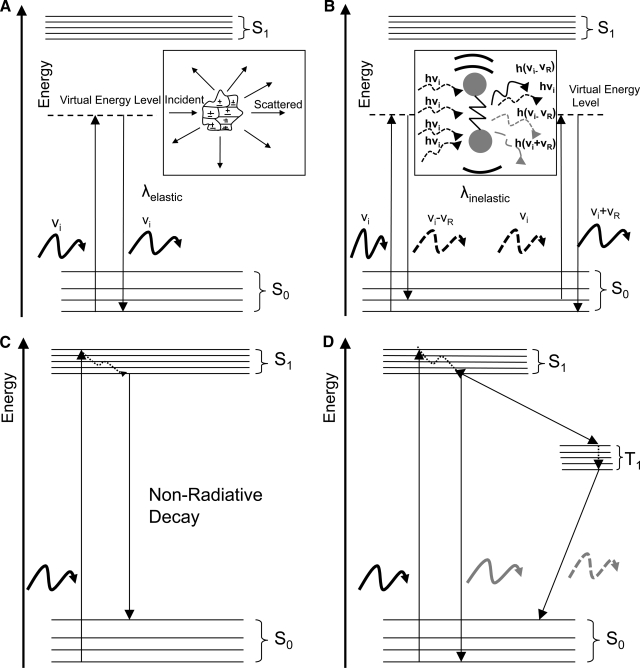
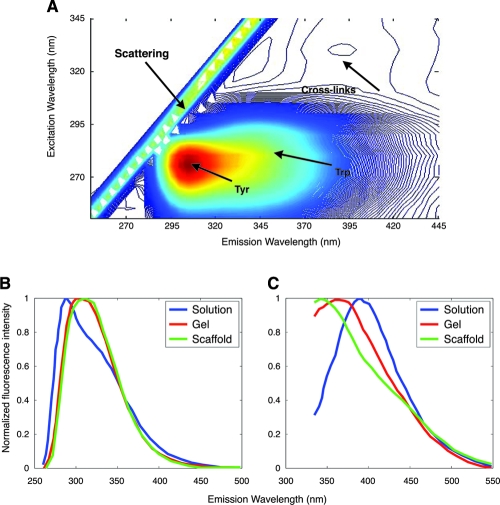
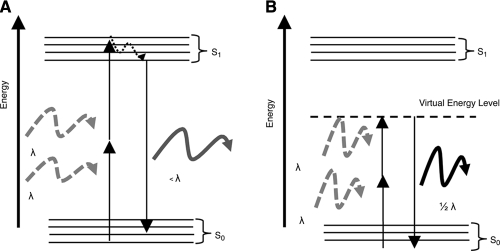
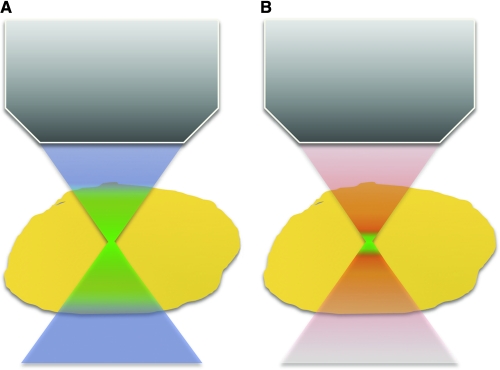
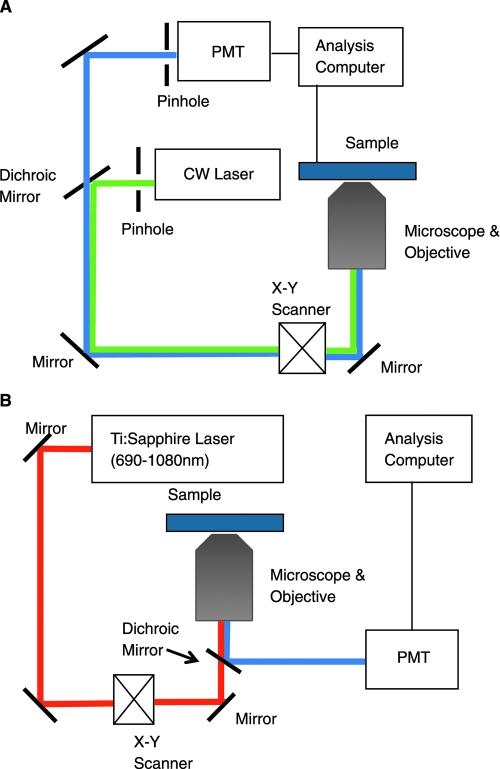
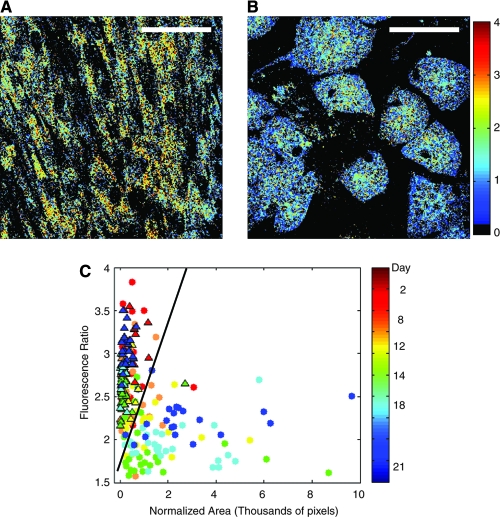
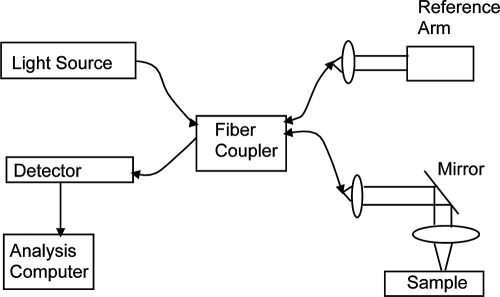
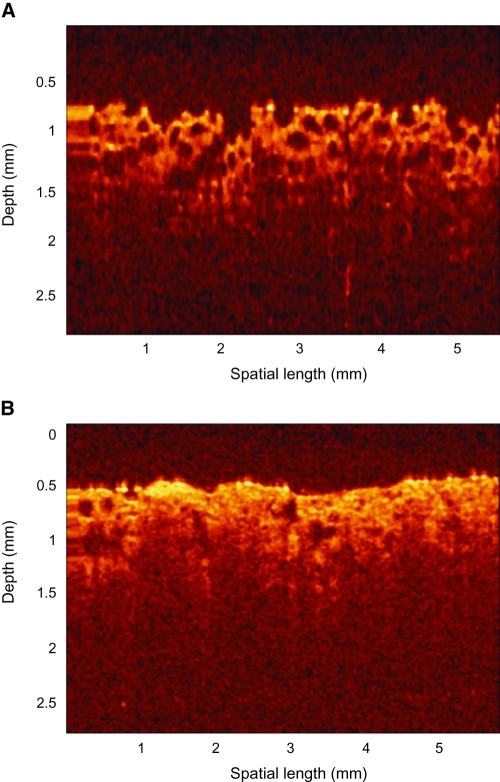
Optical spectroscopy and imaging approaches offer the potential to noninvasively assess different aspects of the cellular, extracellular matrix, and scaffold components of engineered tissues. In addition, the combination of multiple imaging modalities within a single instrument is highly feasible, allowing acquisition of complementary information related to the structure, organization, biochemistry, and physiology of the sample. The ability to characterize and monitor the dynamic interactions that take place as engineered tissues develop promises to enhance our understanding of the interdependence of processes that ultimately leads to functional tissue outcomes. It is expected that this information will impact significantly upon our abilities to optimize the design of biomaterial scaffolds, bioreactors, and cell systems. Here, we review the principles and performance characteristics of the main methodologies that have been exploited thus far, and we present examples of corresponding tissue engineering studies.


Figures

FIG. 1.
FIG. 1.
Energy-level representation of light–matter interactions. (A) Elastic scattering; (B) inelastic Raman scattering; (C) absorption and nonradiative decay; (D) absorption and luminescence.
FIG. 2.
FIG. 2.
Light–tissue interactions. When light interacts with matter, it can undergo the processes of scattering, absorption, and luminescence.
FIG. 3.
FIG. 3.
Silk biomaterial fluorescence. (A) Fluorescence excitation-emission matrix of silk in solution. Arrows indicate major contributions from tyrosine, tryptophan, and crosslinks. (B) Representative fluorescence emission spectra acquired at 265 nm and (C) 310 nm from silk in solution, gel, and scaffold configurations are shown as solid lines. Reproduced with permission from Georgakoudi et al.
FIG. 4.
FIG. 4.
Brightfield and confocal microscopy. (A) The optical path of a bright field microscope includes uniform illumination of a sample. Light from the focal plane as well as from the out-of-focus planes of the objective reaches the detector. (B) The optical path of a confocal microscope relies on focused illumination of a point on the sample, which is then imaged onto a pinhole in front of the detector. Most of the light emanating from the out-of-focus planes does not reach the detector because of the pinhole. (C) Transmission image of a silk scaffold including signal emanating from various planes along the specimen. (D) Corresponding confocal fluorescence image of a silk scaffold, illustrating optical sectioning (bar = 75 μm, magnification: 63× water immersion objective).
FIG. 5.
FIG. 5.
Dependence of image resolution on NA. TPEF (at 800 nm) image stack of a silk scaffold acquired with a (A) 20×, 0.7 NA objective (750 × 750 × 200 μm) and (B) 63×, 1.2 NA water immersion objective (238 × 238 × 200 μm). TPEF (at 740 nm) image sections of J2 fibroblasts acquired through a (C) 20×, 0.7 NA objective and (D) 63×, 1.2 NA water immersion objective. Bar = 75 μm.
FIG. 6.
FIG. 6.
hMSCs on silk scaffold. (A) hMSCs (green) sparsely seeded onto a silk scaffold, stained with calcein AM. Silk (red) is counter stained with ethidium homodimer (10× objective, bar = 300 μm, stack 1500 × 1500 × 630 μm). (B) Thickly seeded GFP-expressing hMSCs (green) on silk scaffold (red) (20× objective, bar = 75 μm, stack 750 × 750 × 210 μm).
FIG. 7.
FIG. 7.
Energy-level representation of nonlinear light–matter interactions. (A) Multiphoton excitation and emission of fluorescence. (B) Second harmonic generation.
FIG. 8.
FIG. 8.
Fluorescence excitation volume in confocal and MPM. (A) Fluorescence (green) is excited throughout the illumination light path (blue) in confocal microscopy. (B) Multiphoton excitation of fluorescence (green) is confined to a small focal volume of the illumination cone (red).
FIG. 9.
FIG. 9.
Schematic of confocal and multiphoton microscopes. (A) Confocal microscope. Precise alignment of the detector pinhole so that it is confocal to the focal point of the objective on the sample is critical. (B) Multiphoton microscope. Collection of the emitted light does not require a pinhole, resulting in a simpler detection design and more efficient signal collection.
FIG. 10.
FIG. 10.
TPEF ratio of hMSCs. Fluorescence ratio of hMSCs after 21 days of culture in propagation medium remains high (panel A), while hMSCs in adipogenic medium (panel B) have a lower ratio. (C) The populations of hMSCs in propagation medium (triangles) and adipogenic medium (circles) can be differentiated by plotting the fluorescence ratio against normalized area [calculated as (1 − eccentricity) × area in thousands of pixels]. Reproduced with permission from Rice et al. 2007.
FIG. 11.
FIG. 11.
Optical coherence tomography. Schematic diagram of a typical OCT system.
FIG. 12.
FIG. 12.
Time-domain optical coherence tomography. TDOCT images of poly(l-lactic acid) scaffolds that are (A) blank and (B) seeded with 4 × 106 cells for 5 weeks. Reproduced with permission from Yang et al.

References

    1. Langer R. Vacanti J.P. Tissue engineering. Science. 1993;260:920–926. - PubMed
    1. Pancrazio J.J. Wang F. Kelley C.A. Enabling tools for tissue engineering. Biosens Bioelectron. 2007;22:2803–2811. - PubMed
    1. Fang H., et al. Noninvasive sizing of subcellular organelles with light scattering spectroscopy. IEEE J Sel Top Quantum Electron. 2003;9:267–276.
    1. Backman V., et al. Measuring cellular structure at submicrometer scale with light scattering spectroscopy. IEEE J Sel Top Quantum Electron. 2001;7:887–893.
    1. Kim Y., et al. Simultaneous measurement of angular and spectral properties of light scattering for characterization of tissue microarchitecture and its alteration in early precancer. IEEE J Sel Top Quantum Electron. 2003;9:243–256.

Publication types

LinkOut - more resources