. 2008 Dec 12;283(50):35164-72.
doi: 10.1074/jbc.M802543200. Epub 2008 Oct 8.

The structure of the glial cell line-derived neurotrophic factor-coreceptor complex: insights into RET signaling and heparin binding

Affiliations

The structure of the glial cell line-derived neurotrophic factor-coreceptor complex: insights into RET signaling and heparin binding

Vimal Parkash et al. J Biol Chem. .

Abstract

Glial cell line-derived neurotrophic factor (GDNF), a neuronal survival factor, binds its co-receptor GDNF family receptor alpha1 (GFR alpha 1) in a 2:2 ratio and signals through the receptor tyrosine kinase RET. We have solved the GDNF(2).GFR alpha 1(2) complex structure at 2.35 A resolution in the presence of a heparin mimic, sucrose octasulfate. The structure of our GDNF(2).GFR alpha 1(2) complex and the previously published artemin(2).GFR alpha 3(2) complex are unlike in three ways. First, we have experimentally identified residues that differ in the ligand-GFR alpha interface between the two structures, in particular ones that buttress the key conserved Arg(GFR alpha)-Glu(ligand)-Arg(GFR alpha) interaction. Second, the flexible GDNF ligand "finger" loops fit differently into the GFR alphas, which are rigid. Third, and we believe most importantly, the quaternary structure of the two tetramers is dissimilar, because the angle between the two GDNF monomers is different. This suggests that the RET-RET interaction differs in different ligand(2)-co-receptor(2)-RET(2) heterohexamer complexes. Consistent with this, we showed that GDNF(2).GFR alpha1(2) and artemin(2).GFR alpha 3(2) signal differently in a mitogen-activated protein kinase assay. Furthermore, we have shown by mutagenesis and enzyme-linked immunosorbent assays of RET phosphorylation that RET probably interacts with GFR alpha 1 residues Arg-190, Lys-194, Arg-197, Gln-198, Lys-202, Arg-257, Arg-259, Glu-323, and Asp-324 upon both domains 2 and 3. Interestingly, in our structure, sucrose octasulfate also binds to the Arg(190)-Lys(202) region in GFR alpha 1 domain 2. This may explain how GDNF.GFR alpha 1 can mediate cell adhesion and how heparin might inhibit GDNF signaling through RET.


Figures
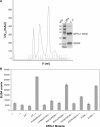
FIGURE 1.
FIGURE 1.
Purification and biochemical analysis of the GDNF2·GFRα12 complex. A, chromatogram of the purification of the GDNF2·GFRα12·SOS2 complex by size exclusion chromatography. Fraction 3 is a high molecular weight aggregate, fraction 6 contains the GDNF2·GFRα12 complex, and fraction 9 contains the excess GFRα1 D23C (GFRα1 D23C was expressed in excess to GDNF). Inset, SDS-PAGE shows low molecular weight (LMW) marker in lane 1 and fraction 6 in lane 2. mAu, milli absorption unit. B, ELISA studies of RET phosphorylation in MG87RET cells in the presence of wild type or various GFRα1 D23C mutants. Negative controls were as follows: -/-, neither GFRα1 nor GDNF added; -/+, only GDNF added. We measured the stimulation by GDNF by performing the experiments in the absence (-) and presence (+) of GDNF with at least four replicates per experiment. Error bars, S.E. of five readings. WT, wild type.
FIGURE 2.
FIGURE 2.
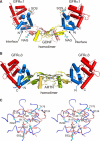
The GDNF2·GFRα12 heterotetrameric complex and the GDNF-GFRα1 interface. A, overall view of the GDNF2·GFRα12·SOS2 complex viewed with the 2-fold axis vertical. The cell membrane surface would be below in this orientation. The GDNF monomers are colored yellow and salmon, the GFRα1 D2s are blue, and the GFRα1 D3s are red. The helices are shown as cylinders, and β-strands are shown as arrows. SOS and N-acetylglucosamine (NAG) are shown as sticks in atom coloring (yellow, sulfur; red, oxygen; blue, nitrogen; cyan, carbon). Disulfide bridges are shown in light blue sticks. B, overall view of the ARTN2·GFRα32 complex (Protein Data Bank code 2GH0 (13)), viewed at the same scale and in the same schematic diagram and orientation as GDNF2·GFRα12 in Fig. 2A. The ARTN monomers are pea green and light yellow, the GFRα3 D2s are blue, and the GFRα3 D3s are red. A and B emphasize the difference in bend angle between the two complexes (see “Results” for details). Since the scale (not shown) is the same, it is clear that the GDNF2·GFRα12 heterotetramer is the more compact of the two complexes. C, close-up view of the GDNF·GFRα1 interface in stereo, showing the interface residues as sticks, color-coded by atoms (red, oxygen; blue, nitrogen; cyan, carbon (GFRα1); salmon, carbon (GDNF)). GFRα1 is shown in a blue loop ribbon, and GDNF is shown in a salmon loop ribbon. The residues mutated in this study are labeled red. This figure and Figs. 3, 4, 5 were made using PyMol (32).
FIGURE 3.
FIGURE 3.
Heparin and SOS binding to GFRα1 D23C and GDNF. A, close-up view of the GFRα1-SOS interface, with GFRα1 as a surface representation colored by charge, and the interacting residues were labeled. The SOS is shown in sticks color-coded as in Fig. 2A. The dashed line represents the spacing between the two 2-O-sulfates of the SOS (10.4 Å) that interact with the Arg-190 to Lys-202 region of GFRα1. Arg-197, beneath the SOS, is marked with an arrow. The residues mutated in this study have red labels. B, stereo view of the interaction between SOS, GFRα1, and GDNF. The GFRα1 is in a sand ribbon, the GDNF (from the neighboring complex in the crystal) is in salmon, and the side chains that interact with the SOS are shown as sticks. The mutated GFRα1 residues have red labels. Hydrogen bonds are shown as black dashed lines. The arrows point to the branch point between the two conformations of Arg-190 and to Lys-194, hidden under GDNF. C, comparison of full-length GFRα1 and truncated GFRα1 D23C binding to the heparin column. Fractions were assayed for 125I-GDNF binding by scintillation proximity assay. GFRα1 D23C and the full-length GFRα1 elute at about 0.5-0.6 m NaCl and 1.0-1.2 m NaCl, respectively. The inset immunoblot, using anti-FLAG antibody, shows that GFRα1 D23C elutes in fractions 20-22, and full-length GFRα1 elutes in fractions 26-28, so 125I-GDNF binding correlates with GFRα1. D, proposed RET binding surface colored by charge. The electrostatic surface view of the GFRα1 D23 is shown. The RET-interacting residues mutated in this study are labeled in red, except for Glu-323 and Asp-324, which have white labels. The orientation is as in A.
FIGURE 4.
FIGURE 4.
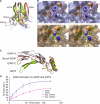
Comparison of the GDNF2·GFRα12 and ARTN2·GFRα32 complexes. A, superposition of the GFL·GFRα monomers to show the difference in approach between GDNF and ARTN viewed from above looking into the triangular helix spiral. The GFRαs were superimposed. Sand, GFRα1; slate, GFRα3; salmon, GDNF; pea green, ARTN. This view emphasizes the difference in rotation between GDNF and ARTN finger loops above the triangle of helices. B, close-up of the “cross-talk” ligand-co-receptor complex interfaces in stereo. In the top panel, the GFRα3 in a partially transparent surface representation is positioned below GDNF, and GFRα1 is shown similarly below ARTN in the bottom panel. The GFRα1, GFRα3, GDNF, and ARTN are in same color and alignment as in A. The key differences between GFRα1 and GFRα3 are shown in orange balls, and the two arginines of the ion triple are in balls with carbon (sand), oxygen (red), and nitrogen (blue). The key GDNF (Glu-61, Leu-114, and Tyr-120) and ARTN (Glu-143, Met-199, and Trp-205) residues are shown as ball-and-stick models. C, the ligand bend angle difference. The conserved ligand monomer heel structures were aligned to show the relative inclination of the finger loops. Two conformations of GDNF (25) (Protein Data Bank code 1AGQ; chain A in steel gray and chain C in brown), GDNF (salmon) from our complex structure, and ARTN (pea green) from Wang et al. (13) are shown. For a clear view, only heel and finger 2 are shown for all the GDNF and ARTN monomers. D, kinetics of MAPK activation by GDNF or ARTN monitored by luciferase activity. The luciferase activity value after a 24-h incubation with corresponding neurotrophic factors is normalized to 100%.
FIGURE 5.
FIGURE 5.
Heparin modeling. Shown is modeling of heparin (pentasaccharide, Protein Data Bank code 1AXM (48); chain G) onto GFRα1 to show the possible interaction of heparin with GFRα1. The 2-O-sulfates of the heparin oligomer were aligned to the two interacting sulfate groups of SOS (root mean square deviation of 0.21 Å), which bind positively charged residues of GFRα1 (residues 190-202) in the GDNF2·GFRα12·SOS2 structure (Fig. 3A). The pentasaccharide is shown as sticks, color-coded as SOS in Fig. 2A. The GFRα1 surface is colored by charge. 2-O-Sulfates are shown in magenta.

References

    1. Lin, L.-F., Doherty, D. H., Lile, J. D., Bektesh, S., and Collins, F. (1993) Science 260 1130-1132 - PubMed
    1. Airaksinen, M. S., and Saarma, M. (2002) Nat. Rev. Neurosci. 3 383-394 - PubMed
    1. Shults, C. W., Kimber, T., and Martin, D. (1996) Neuroreport 7 627-631 - PubMed
    1. Yasuhara, T., Shingo, T., and Date, I. (2007) Acta Med. Okayama 61 51-56 - PubMed
    1. Kotzbauer, P. T., Lampe, P. A., Heuckeroth, R. O., Golden, J. P., Creedon, D. J., Johnson, E. M., Jr., and Milbrandt, J. (1996) Nature 384 467-470 - PubMed

Publication types

MeSH terms

Associated data