. 2009 Mar;16(3):266-78.
doi: 10.1038/cgt.2008.74. Epub 2008 Oct 10.

Enhanced oncolytic potency of vesicular stomatitis virus through vector-mediated inhibition of NK and NKT cells

Affiliations

Enhanced oncolytic potency of vesicular stomatitis virus through vector-mediated inhibition of NK and NKT cells

J Altomonte et al. Cancer Gene Ther. 2009 Mar.

Abstract

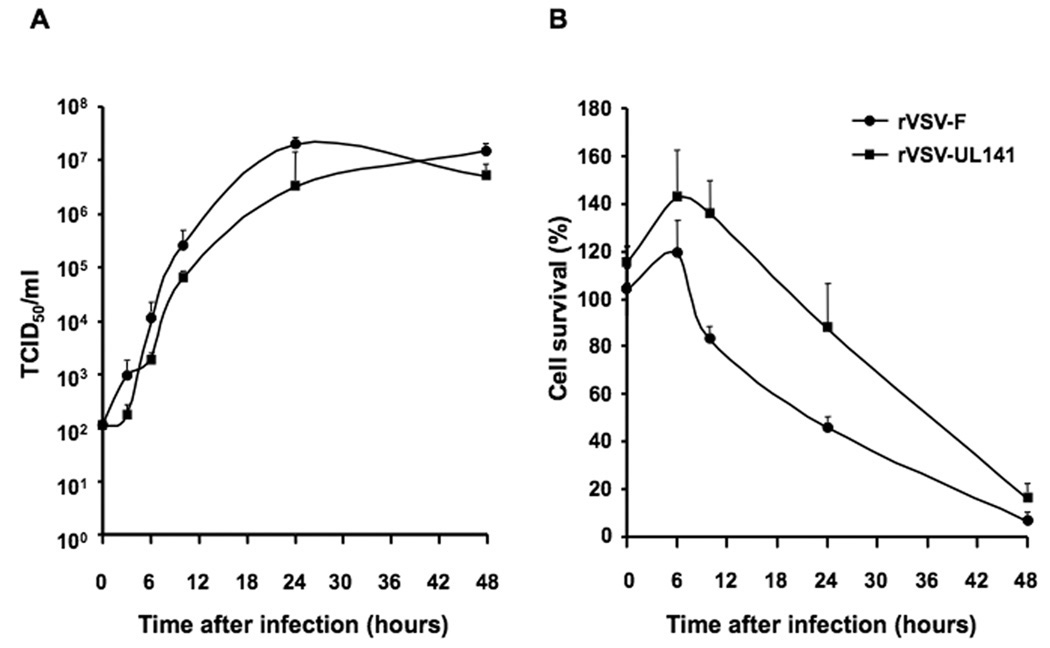
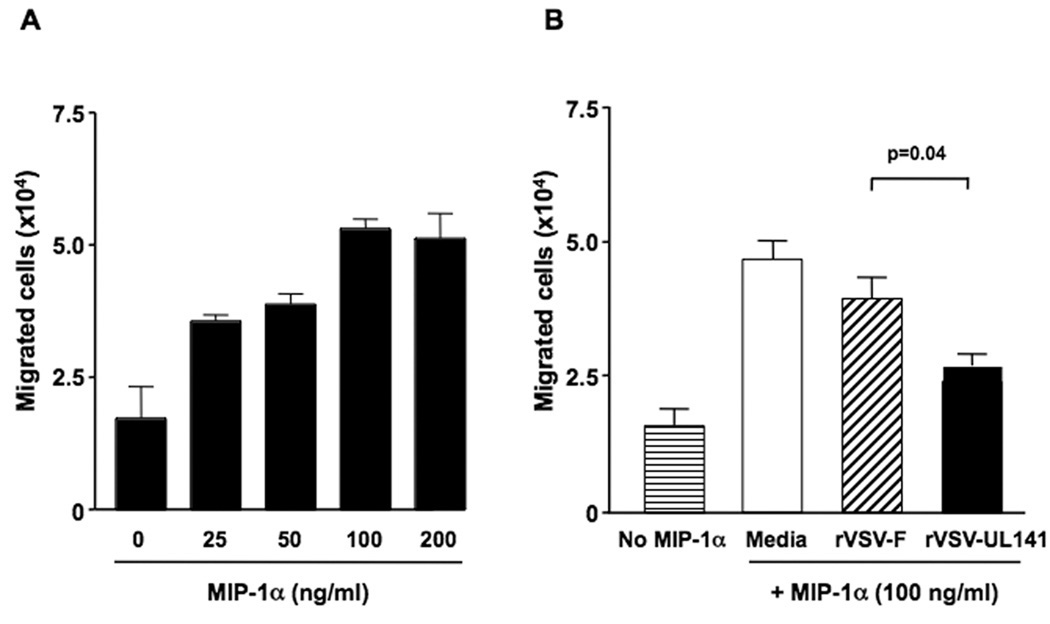
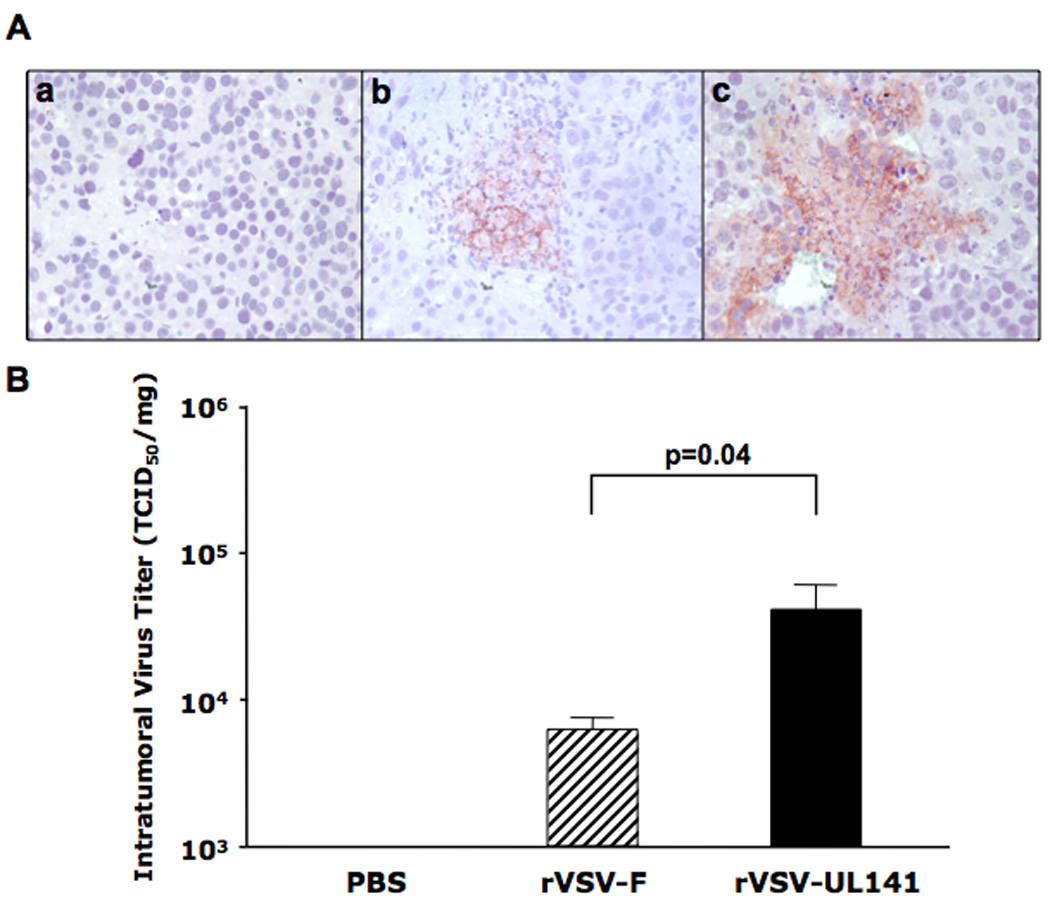
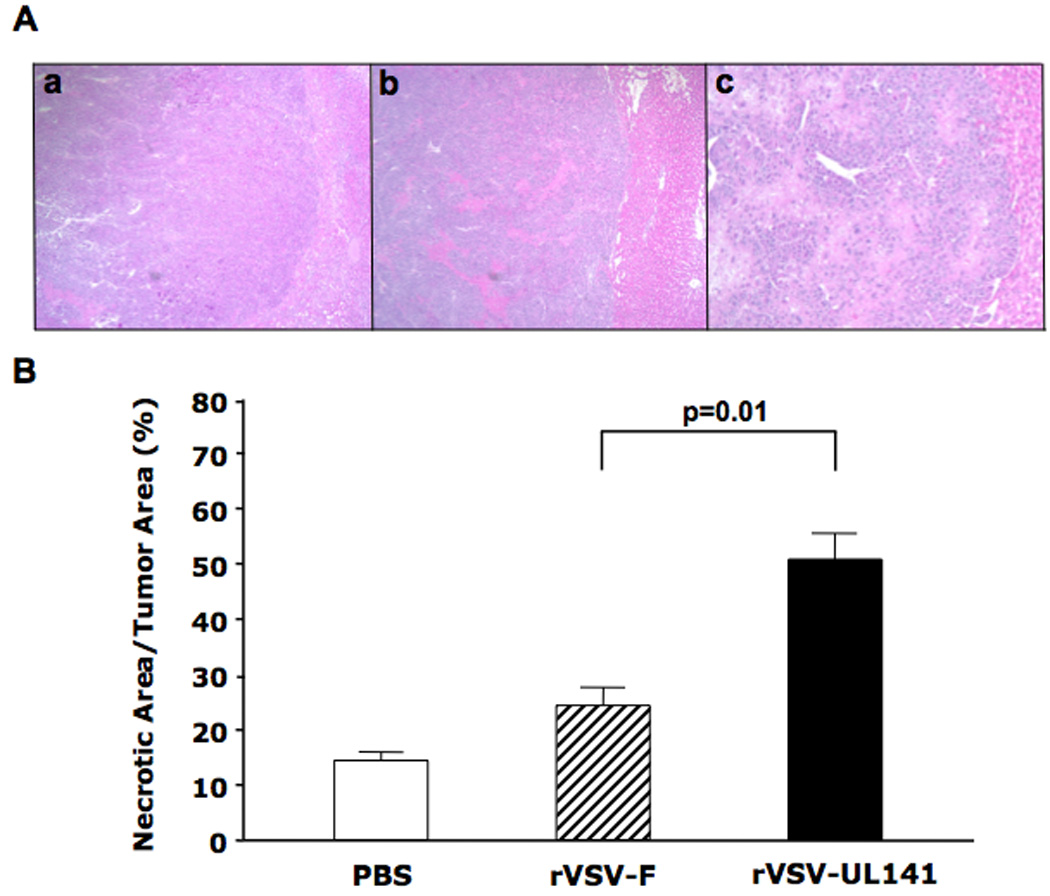
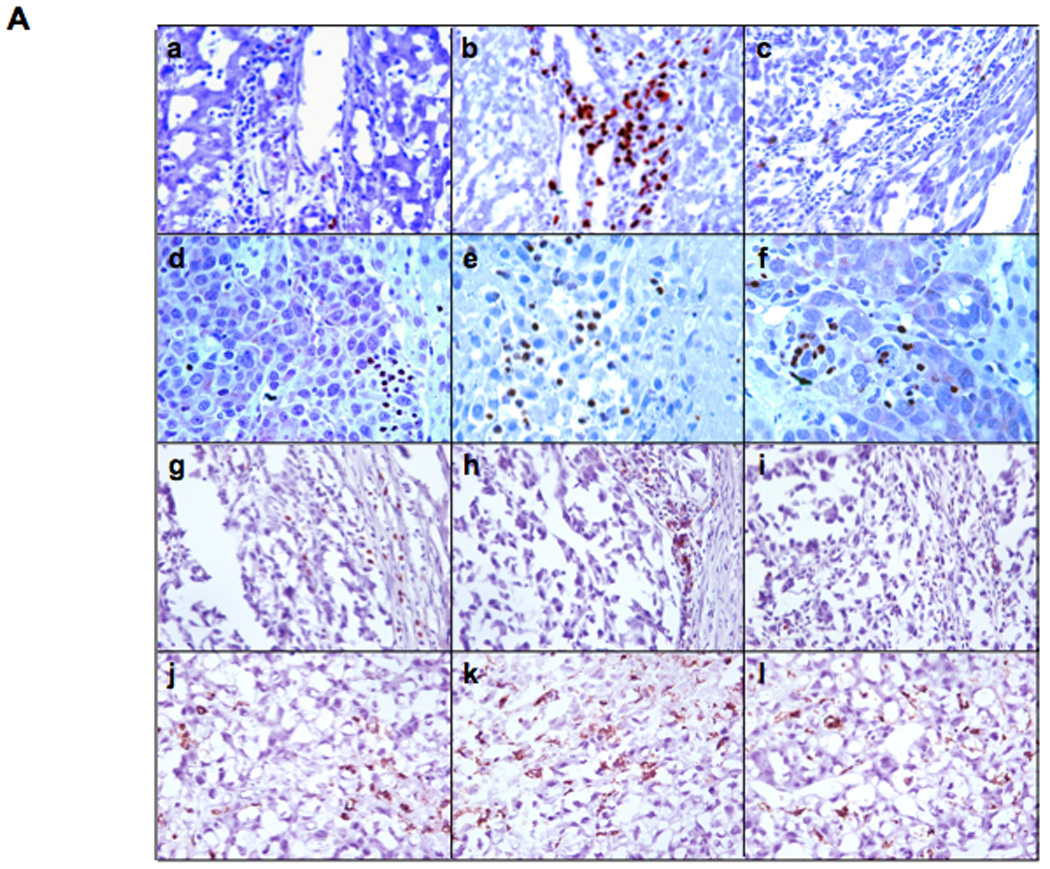
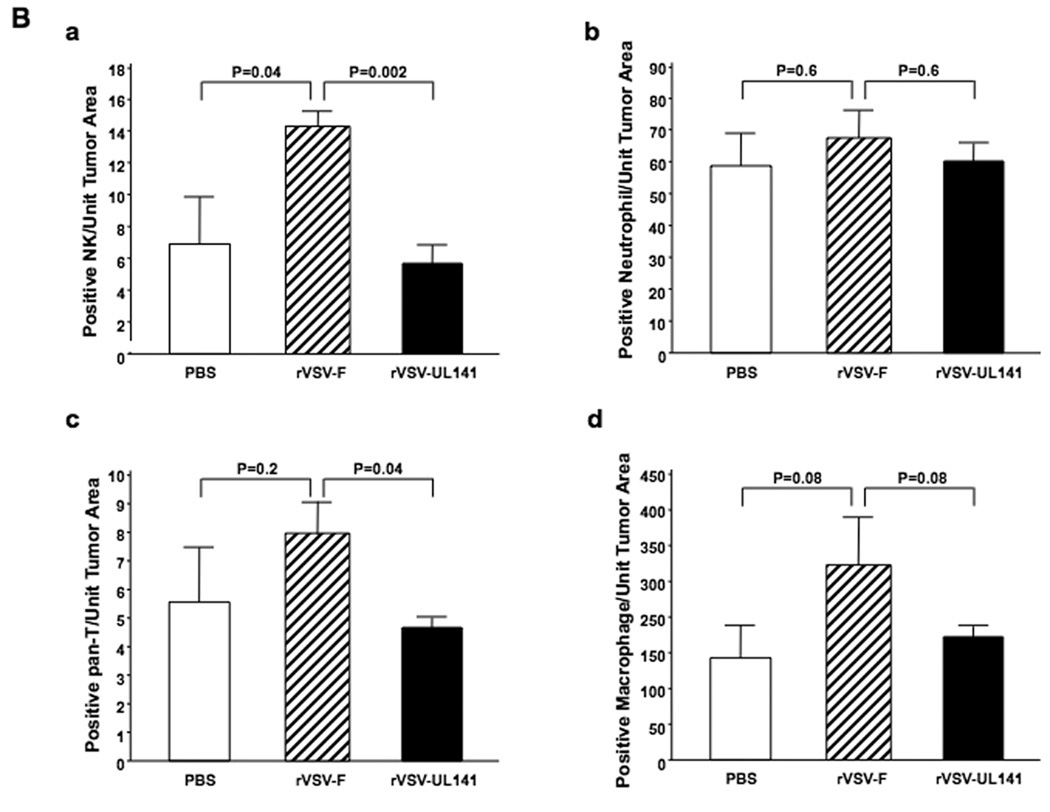
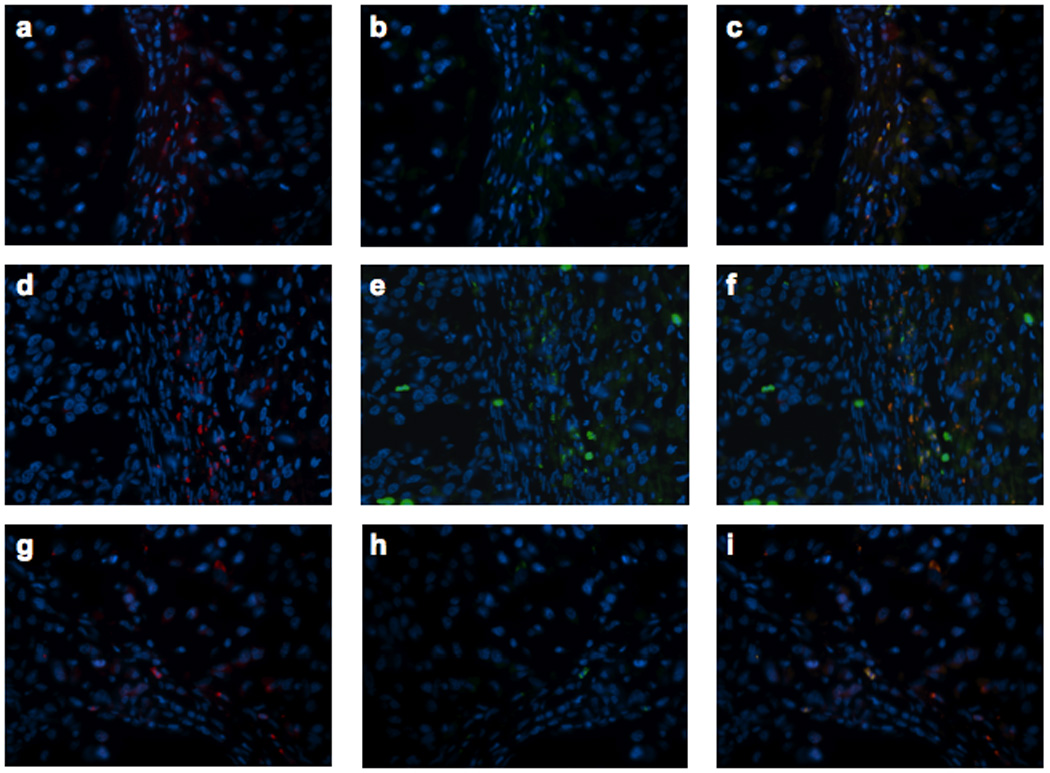
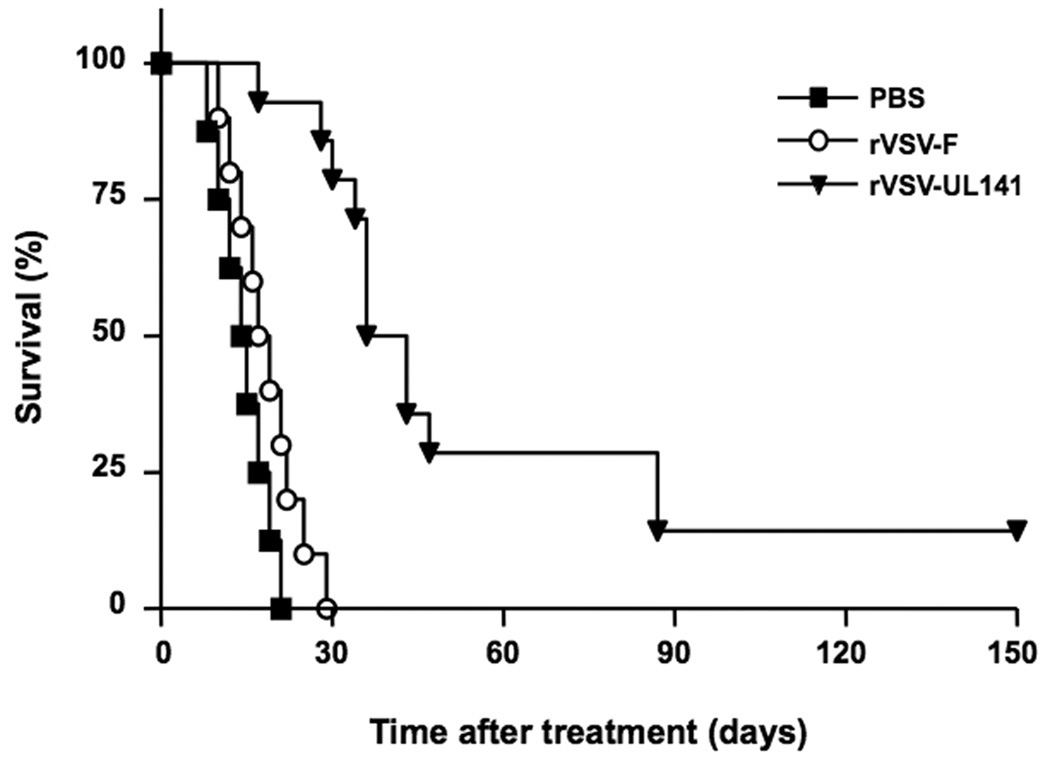
Recombinant oncolytic viruses represent a promising alternative option for the treatment of malignant cancers. We have reported earlier the safety and efficacy of recombinant vesicular stomatitis virus (VSV) vectors in a rat model of hepatocellular carcinoma (HCC). However, the full potential of VSV therapy is limited by a sudden decline in intratumoral virus replication observed early after viral administration, a phenomenon that coincides with an accumulation of inflammatory cells within infected lesions. To overcome the antiviral function of these cells, we present a recombinant virus, rVSV-UL141, which expresses a protein from human cytomegalovirus known to downregulate the natural killer (NK) cell-activating ligand CD155. The modified vector resulted in an inhibition of NK cell recruitment in vitro, as well as decreased intratumoral accumulations of NK and NKT cells in vivo. Administration of rVSV-UL141 through hepatic artery infusion in immune-competent Buffalo rats harboring orthotopic, multi-focal HCC lesions resulted in a one-log elevation of intratumoral virus replication over a control rVSV vector, which translated to enhance tumor necrosis and substantial prolongation of survival. Moreover, these results were achieved in the absence of apparent toxicities. The present study suggests the applicability of this strategy for the development of effective and safe oncolytic agents to treat multi-focal HCC, and potentially a multitude of other cancers, in the future.


Figures

Figure 1
Figure 1. Viral replication and cell killing by rVSV-UL141 versus rVSV-F in Morris (McA-RH7777) rat hepatoma cells in vitro
Rat hepatoma cells were infected with rVSV-F or rVSV-UL141 at MOI = 0.01. Panel A, TCID50 assay was performed on conditioned media at 0, 3, 6, 10, 24, and 48 hours post-infection; Panel B, MTT assays for cell viability were performed at 0, 3, 6, 10, 24, and 48 hours post-infection. Triplicate samples were analyzed at each time point. Data are shown as mean + standard deviation.
Figure 2
Figure 2. Inhibition of Natural Killer (NK) cell migration by conditioned media from rVSV-UL141, but not rVSV-F, infected rat HCC cells
Panel A, dose response of rat NK cell migration in response to rat MIP-1α. The migration assays were performed using 24-well transwell plates. The migration of rat NK cells from the upper chamber to the lower chamber in response to serially diluted rat MIP-1α (0~200ng/ml) was monitored. Panel B, inhibition of NK cell migration in response to MIP-1α by conditioned media from rVSV infected rat HCC cells. The migration assays were performed using 24-well transwell plates. The migration of rat NK cells from the upper chamber to the lower chamber in response to 100ng/ml of MIP-1α was monitored in the presence of ultrafiltered and UV-inactivated supernatants from 105 HCC cells infected with rVSV-UL141 or rVSV-F. Data presented are the mean values of four independent experiments and the results were analyzed statistically by two-sided student t test.
Figure 3
Figure 3. rVSV-UL141 versus rVSV-F replication in HCC tumors in the livers of immune-competent Buffalo rats
Multi-focal HCC-bearing Buffalo rats were treated with PBS (n=3), rVSV-F (n=4) or rVSV-UL141 (n=4) at 1×10⁷ pfu/rat injected through the hepatic artery. Tumor samples were obtained from the treated rats at day 3 after virus infusion. 5 µm tumor sections were stained with a monoclonal anti-VSV-G antibody and counterstained with Hematoxylin (Panel A). Representative sections from rats treated with PBS, rVSV-F and rVSV-UL141 are shown in frames a, b and c, respectively (magnification=40×). In panel B, intratumoral virus titers were determined by TCID50 assays performed using tumor extracts on BHK-21 cells. Viral titers are expressed as TCID50/mg tissue (mean ± sstandard deviation), and the results were analyzed statistically by two-sided student t test.
Figure 4
Figure 4. Enhanced tumor response in rats treated with rVSV-UL141 versus those treated with rVSV-F
Multi-focal HCC-bearing Buffalo rats were injected via the hepatic artery with PBS (n=3), rVSV-F (n=4) or rVSV-UL141 (n=4) at 1×10⁷ pfu/rat and sacrificed 3 days post-treatment. Panel A, 5 µm tumor sections were stained with H&E. Representative sections from rats treated with PBS, rVSV-F and rVSV-UL141 are shown in frames a, b and c, respectively (magnification=40×). Panel B, Percentage of necrotic areas in the tumors were measured morphometrically using ImagePro software. Data are shown as mean ± standard deviation, and the results were analyzed statistically by two-sided student t test.
Figure 5
Figure 5. Immunohistochemical staining and semi-quantification of immune cells in tumors
Panel A, representative immunohistochemical sections from tumors and surrounding tissues. Tumor-bearing rats were infused with PBS (frames a, d, g, j), rVSV-F (frames b, e, h, k) or rVSV-UL141 (frames c, f, i, l) at 1×10⁷ pfu/ml/rat. Samples were obtained from rats at day 3 after virus infusion into the hepatic artery. 5 µm sections were stained with mouse monoclonal anti-NKR-P1A (frames a, b, c), polyclonal anti-myeloperoxidase (frames d, e, f), monoclonal anti-OX-52 (frames g, h, i) and monoclonal anti-ED-1 (frames j, k, l), (magnification=40×). Panel B, semi-quantification of immune cells in the lesions after virus treatment: NK cells (graph a), neutrophils (graph b), pan-T cells (graph c) and macrophages (graph d) by ImagePro software. Immune cell index was calculated as ratio of positive cell to unit tumor area (10,000 pixel as one unit tumor area), and the results were analyzed statistically by two-sided student t-test.
Figure 6
Figure 6. Immunofluorescent staining of T and NK cells in tumors
Tumor bearing Buffalo rats were infused via the hepatic artery with PBS (frames a to c), rVSV-F (frames d to f) or rVSV-UL141 (frames g to i) at 1×10⁷ pfu/ml/rat. Samples were obtained at day 3 after virus infusion. 5 µm frozen sections were fixed with cold acetone and blocked with 4% goat serum, followed by staining with R-PE-conjugated mouse anti-rat CD3 monoclonal antibody (frames a, d and g) and FITC-conjugated mouse anti-rat NKR-P1A (frames b, e and h). Merged pictures are shown in frames c, f and i, respectively. Original magnification ×40.
Figure 7
Figure 7
Kaplan-Meier survival curve of multi-focal HCC-bearing Buffalo rats after hepatic arterial infusion of PBS (n=8), rVSV-F (n=10) or rVSV-UL141 (n=14) at 1×10⁷ pfu/ml/rat. Survival was monitored daily and the results were analyzed statistically by log rank test (p<0.001 for rVSV-UL141 versus rVSV-F).

References

    1. Parkin DM, Sthernsward J, Muir CS. Estimates of the worldwide frequency of twelve major cancers. Bull World Health Organ. 1984;62(2):163–182. - PMC - PubMed
    1. Murray CJaL AD. Evidence-based health policy - lessons from the Global Burden of Disease Study. Science. 1996;274(5288):740–743. - PubMed
    1. Parkin DM, Bray F, Ferlay J, Pisani P. Estimating the world cancer burden: Globocan 2000. Int J Cancer. 2001;94:153–156. - PubMed
    1. El-Serag HBaM AC. Rising incidence of hepatocellular carcinoma in the United States. N Engl J Med. 1999;340(10):745–750. - PubMed
    1. Dyer Z, Peltekian K, van Zanten SV. The changing epidemiology of hepatocellular carcinoma in Canada. Aliment Pharmacol Ther. 2005;22(1):17–22. - PubMed

Publication types

MeSH terms