. 2008 Oct;4(10):e1000214.
doi: 10.1371/journal.pgen.1000214. Epub 2008 Oct 10.

High-resolution mapping of expression-QTLs yields insight into human gene regulation

Affiliations

High-resolution mapping of expression-QTLs yields insight into human gene regulation

Jean-Baptiste Veyrieras et al. PLoS Genet. 2008 Oct.

Abstract

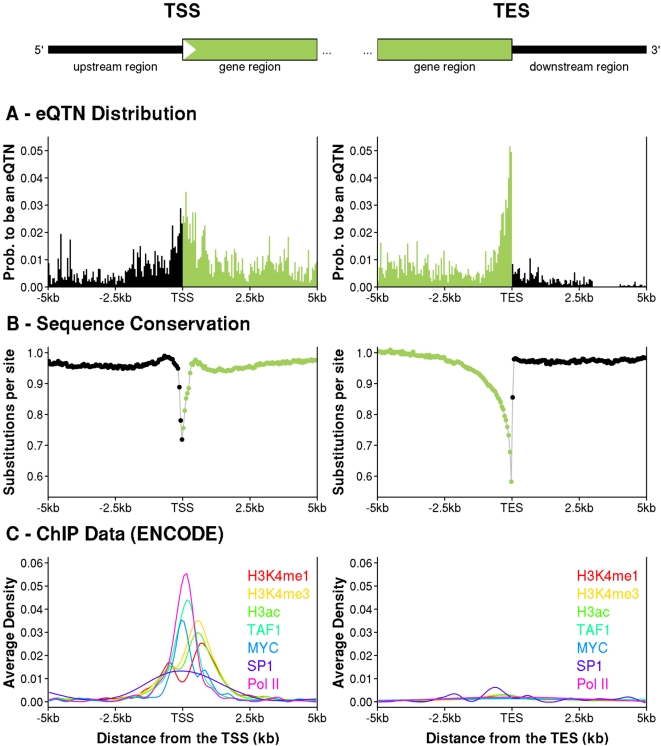
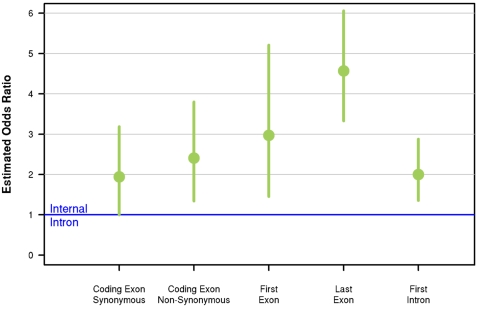
Recent studies of the HapMap lymphoblastoid cell lines have identified large numbers of quantitative trait loci for gene expression (eQTLs). Reanalyzing these data using a novel Bayesian hierarchical model, we were able to create a surprisingly high-resolution map of the typical locations of sites that affect mRNA levels in cis. Strikingly, we found a strong enrichment of eQTLs in the 250 bp just upstream of the transcription end site (TES), in addition to an enrichment around the transcription start site (TSS). Most eQTLs lie either within genes or close to genes; for example, we estimate that only 5% of eQTLs lie more than 20 kb upstream of the TSS. After controlling for position effects, SNPs in exons are approximately 2-fold more likely than SNPs in introns to be eQTLs. Our results suggest an important role for mRNA stability in determining steady-state mRNA levels, and highlight the potential of eQTL mapping as a high-resolution tool for studying the determinants of gene regulation.


Conflict of interest statement

The authors have declared that no competing interests exist.

Figures

Figure 1
Figure 1. SNP association data often allow relatively precise localization of cis-eQTL signals.
The plots show examples of eQTLs for three genes: MOSC1, ACOX3 and GLT1D1. The x-axis on each plot indicates distance from the transcription start site. The transcribed regions are indicated by the green boxes and in all three plots the direction of transcription is left-to-right. For each SNP we plot the −log10(p-value) for association between genotype at that SNP and expression level of the gene. We use green to indicate SNPs that lie within the transcript of interest, and black for SNPs outside the transcript (this coloring is used for all the figures). The dotted line indicates the threshold for a gene-level FDR of 5% (p = 7×10⁻⁶).
Figure 2
Figure 2. Locations of the most significant eQTL SNPs for small, medium, and large genes.
Each plot shows, for genes with an eQTL, the distribution of locations of the most significant SNP. The x-axis of each plot divides a typical cis-candidate region into a series of bins as described. The y-axis plots the number of SNPs in each bin that are the most significant SNP for the corresponding gene and that have a p-value <7×10⁻⁶ divided by the total number of SNPs in that bin. The plotted data include an adjustment for the effect of unknown SNPs inside probes (Methods). SNPs outside genes are assigned to bins based on their physical distance from the TSS (for upstream SNPs), or TES (downstream SNPs). SNPs inside genes are assigned to bins based on their fractional location within the gene. There are 5372 “small” genes, of which 300 have an eQTL, 4489 medium genes (347 eQTLs), and 1585 large genes (94 eQTLs). The size of the schematic gene at the bottom of each plot indicates the average transcript length for that set of genes.
Figure 3
Figure 3. Locations of eQTNs, as estimated by the hierarchical model.
The three left-hand panels plot the estimated fractions of SNPs in each bin that are eQTNs, using the posterior expected numbers of eQTNs in each bin from the hierarchical model. The right-hand panels plot the corresponding cumulative distributions of detected eQTNs, as a function of position across the cis-candidate region. The horizontal green lines indicate the gene boundaries; the vertical red lines indicate the 1% and 99% tails of the cumulative distributions. The numbers of eQTNs in each bin were calculated as the posterior expected numbers based on the SNP posterior probabilities from the hierarchical model.
Figure 4
Figure 4. Fine-scale structure of eQTN peaks near the TSS and TES, and comparison to average sequence conservation and transcription factor binding density.
The left- and right-hand columns show data for 5 kb on either side of the TSS and TES, respectively (averaging across all gene sizes). Locations inside genes are colored green and outside genes are black. A. Posterior expected fractions of SNPs in each bin that are eQTNs, as estimated by the hierarchical model (see Methods). Each bin is 50 bp wide. B. The average number of substitutions per base pair across the phylogeny of seven mammalian species for all 11,446 genes analyzed in this study (see Methods). Coding sequences were excluded. Each data point is the average across a 50 bp bin. C. The average density of factor binding fragments for seven factors related to transcription initiation and studied by ENCODE using ChIP-chip in 1% of the genome . The TSS part of panel C replots data (H3K4me1, H3K4me3, H3ac, MYC and Pol II) from Figure 5 of .
Figure 5
Figure 5. Expression-QTNs are under-represented in coding sequence introns, even after controlling for position effects.
The plot shows the odds ratios for the probability that a SNP in a particular part of the gene (e.g., coding exon) is inferred to be an eQTN, relative to that probability for a SNP in an “internal” intron (i.e., an intron within the coding sequence). The odds ratios are estimated using the hierarchical model with internal introns fixed at a value of 1, and control for SNP position using the TSS+TES model. The vertical bars show 95% confidence intervals.

References

    1. Knight J. Regulatory polymorphisms underlying complex disease traits. Journal of Molecular Medicine. 2005;83:97–109. - PMC - PubMed
    1. Kleinjan D, van Heyningen V. Long-Range Control of Gene Ex-pression: Emerging Mechanisms and Disruption in Disease. The American Journal of Human Genetics. 2005;76:8–32. - PMC - PubMed
    1. Wray G. The evolutionary significance of cis-regulatory mutations. Nat Rev Genet. 2007;8:206–216. - PubMed
    1. ENCODE Project Consortium. Identification and analysis of functional elements in 1% of the human genome by the ENCODE pilot project. Nature. 2007;447:799–816. - PMC - PubMed
    1. Kim T, Abdullaev Z, Smith A, Ching K, Loukinov D, et al. Analysis of the Vertebrate Insulator Protein CTCF-Binding Sites in the Human Genome. Cell. 2007;128:1231–1245. - PMC - PubMed

Publication types