. 2008 Nov;118(11):3775-89.
doi: 10.1172/JCI35711. Epub 2008 Oct 9.

NFATc1 in mice represses osteoprotegerin during osteoclastogenesis and dissociates systemic osteopenia from inflammation in cherubism

Affiliations

NFATc1 in mice represses osteoprotegerin during osteoclastogenesis and dissociates systemic osteopenia from inflammation in cherubism

Antonios O Aliprantis et al. J Clin Invest. 2008 Nov.

Abstract

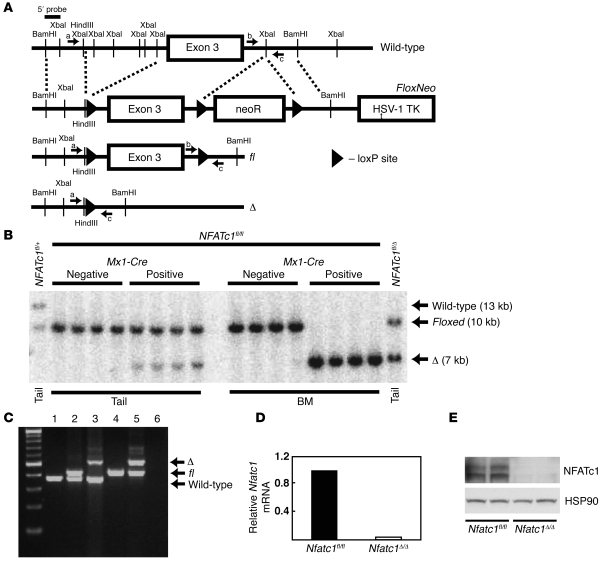
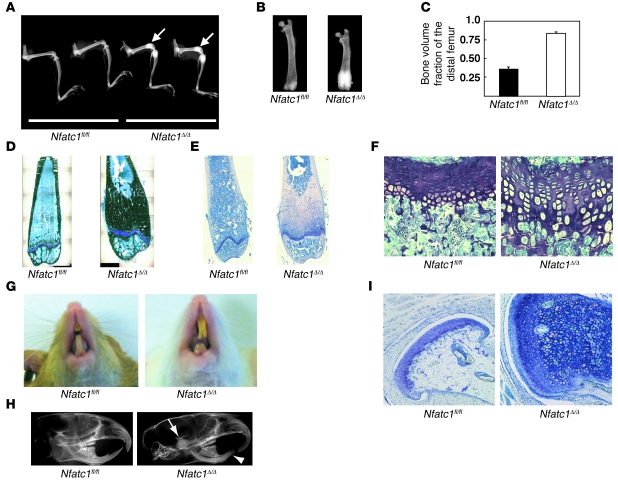
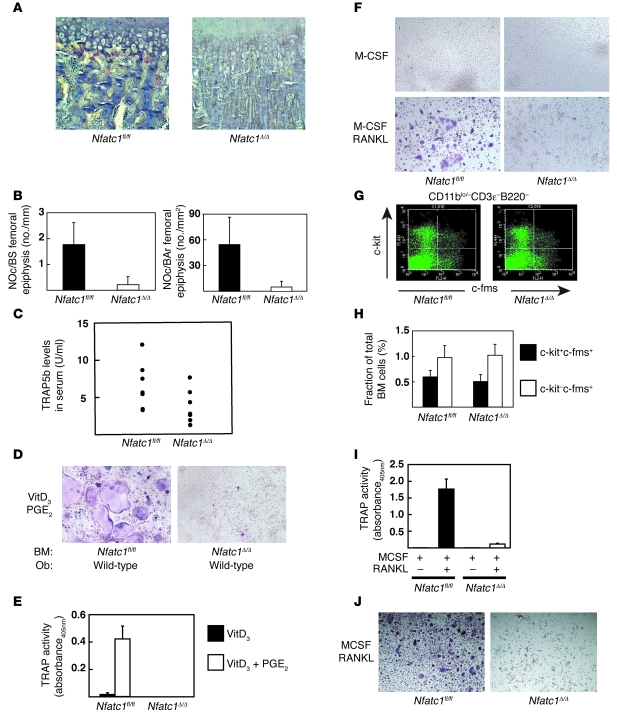
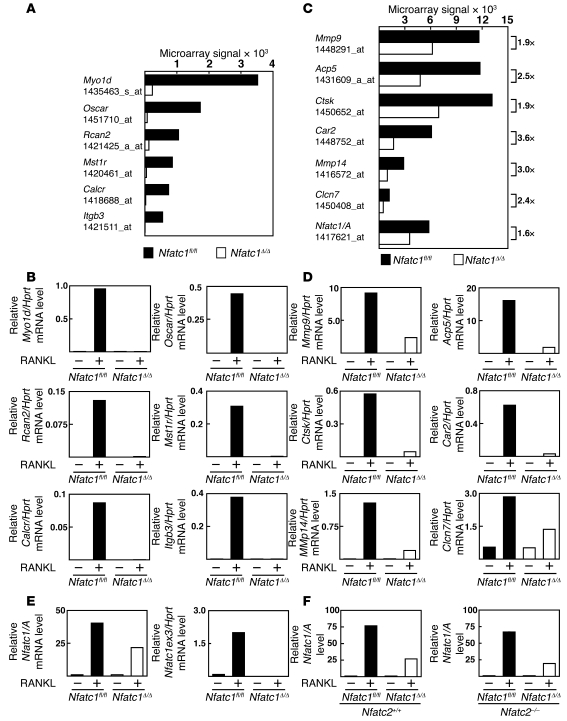
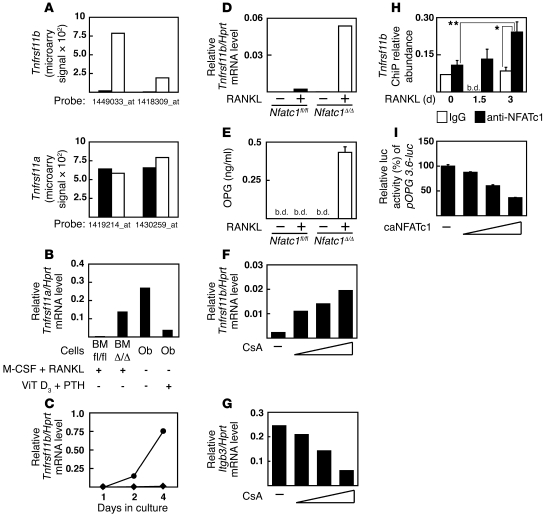
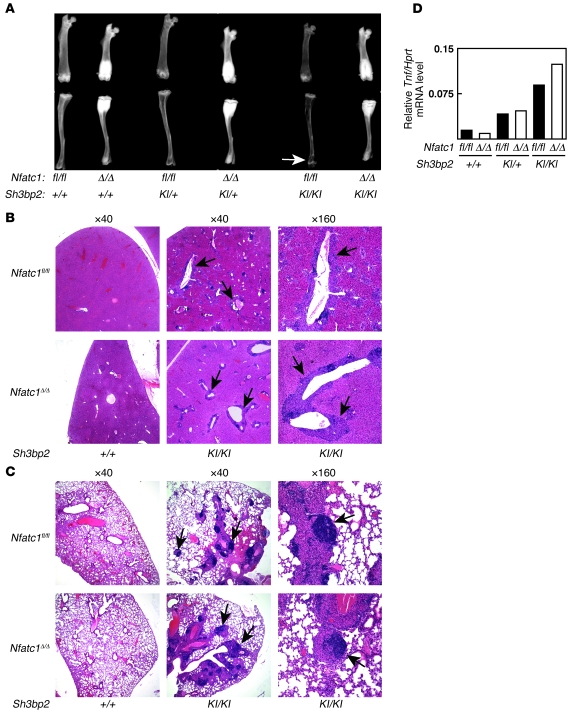
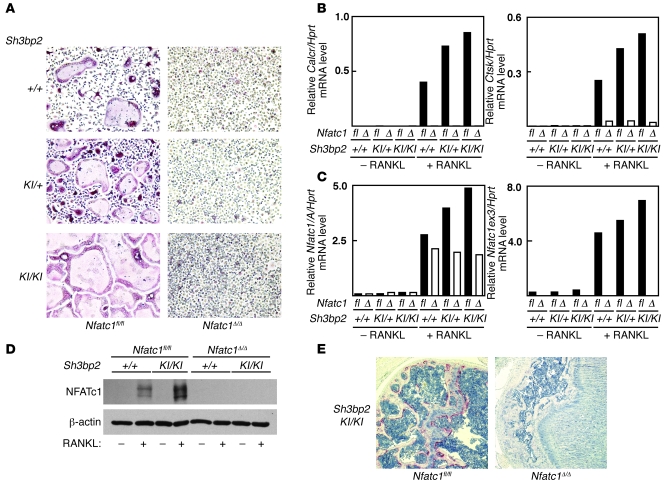
Osteoporosis results from an imbalance in skeletal remodeling that favors bone resorption over bone formation. Bone matrix is degraded by osteoclasts, which differentiate from myeloid precursors in response to the cytokine RANKL. To gain insight into the transcriptional regulation of bone resorption during growth and disease, we generated a conditional knockout of the transcription factor nuclear factor of activated T cells c1 (Nfatc1). Deletion of Nfatc1 in young mice resulted in osteopetrosis and inhibition of osteoclastogenesis in vivo and in vitro. Transcriptional profiling revealed NFATc1 as a master regulator of the osteoclast transcriptome, promoting the expression of numerous genes needed for bone resorption. In addition, NFATc1 directly repressed osteoclast progenitor expression of osteoprotegerin, a decoy receptor for RANKL previously thought to be an osteoblast-derived inhibitor of bone resorption. "Cherubism mice", which carry a gain-of-function mutation in SH3-domain binding protein 2 (Sh3bp2), develop osteoporosis and widespread inflammation dependent on the proinflammatory cytokine, TNF-alpha. Interestingly, deletion of Nfatc1 protected cherubism mice from systemic bone loss but did not inhibit inflammation. Taken together, our study demonstrates that NFATc1 is required for remodeling of the growing and adult skeleton and suggests that NFATc1 may be an effective therapeutic target for osteoporosis associated with inflammatory states.


Figures

Figure 1
Figure 1. Generation of an Nfatc1 conditional knockout mouse.
(A) Graphic representation of the Nfatc1 conditional targeting strategy. Flanking exon 3 of Nfatc1 with loxP sites generated the floxed allele (fl). Cre-mediated recombination of the loxP sites results in the delta allele (Δ). The approximate locations of the 5′ probe used for Southern blotting and PCR primers (see Methods) employed for genotyping (a, b, and c) are shown. HSV-1 TK, herpes simplex virus–1 thymidine kinase cassette; neoR, neomycin resistance cassette. (B) Southern blot analysis of tail and BM genomic DNA from poly I:C–treated Nfatc1fl/fl (n = 4) and littermate Nfatc1fl/fl, Mx1-Cre (n = 4) mice. Genomic tail DNA from Nfatc1fl/+ and Nfatc1fl/Δ mice are shown for comparison. (C) Three primer genotyping PCR, using primers a, b, and c shown in A, of tail genomic DNA from mice of the following genotypes: Nfatc1+/+ (lane 1), Nfatc1fl/+ (lane 2), Nfatc1+/Δ (lane 3), Nfatc1fl/fl (lane 4), Nfatc1fl/Δ (lane 5). A 100-bp ladder and DNA diluent negative control (lane 6) are shown. (D) qRT-PCR analysis for Nfatc1 (using primer set Nfatc1ex3; Table 1) in mRNA samples from Nfatc1fl/fl and Nfatc1Δ/Δ BM. (E) Western blot analysis for NFATc1 and HSP90 (loading control) in protein lysates from Nfatc1fl/fl (n = 2) and Nfatc1Δ/Δ (n = 2) splenocytes.
Figure 2
Figure 2. Nfatc1Δ/Δ mice develop osteopetrosis.
(A) Lateral digital radiograph of the leg of 5-month-old female Nfatc1fl/fl (n = 2) and Nfatc1Δ/Δ (n = 2) mice. The white arrows show increased radiodensity at the distal femurs. (B) Anteroposterior digital radiograph of the femur of 5-month-old female Nfatc1fl/fl and Nfatc1Δ/Δ mice. (C) The bone volume to total volume fraction was determined by microquantitative computed tomography at the distal femur of 6 male Nfatc1fl/fl (black bar, n = 2 at 2.5 months old and n = 4 at 5 months old) and 4 male Nfatc1Δ/Δ (white bar, n = 2 at 2.5 months old and n = 2 at 5 months old) mice. The data are the mean + SD; P < 1 × 10⁻⁸. (D) Von Kossa and (E) toluidine blue stains of the distal femur of 5-month-old female Nfatc1fl/fl and Nfatc1Δ/Δ mice. Pictures are a montage of low-power images. (F) Toluidine blue stain (original magnification, ×400) of the femoral growth plate of 9-week-old male Nfatc1fl/fl and Nfatc1Δ/Δ mice. (G) Photograph of the snout of 5.5-month-old male Nfatc1fl/fl and Nfatc1Δ/Δ mice. (H) Lateral radiograph of the skull of 2.5-month-old female Nfatc1fl/fl and Nfatc1Δ/Δ mice. White arrowhead denotes lack of impaction of the lower incisors. White arrow shows increased radiodensity at the mandibular condyle. (I) Toluidine blue stain (original magnification, ×100) of the mandibular condyle of 3-month-old female Nfatc1fl/fl and Nfatc1Δ/Δ mice. Radiographs and histology images are representative of at least 8 (long bones) or 3 (mandibles) mice analyzed per genotype.
Figure 3
Figure 3. Nfatc1Δ/Δ mice display impaired osteoclast differentiation in vivo and in vitro.
(A) TRAP stain of the femoral growth plates of 9-week-old male Nfatc1fl/fl and Nfatc1Δ/Δ mice. Images are representative of at least 8 mice analyzed per genotype. (B) Histomorphometric enumeration of osteoclasts within the femoral epiphysis of 5-month-old female Nfatc1fl/fl and Nfatc1Δ/Δ mice (n = 4/genotype). The data is the mean + SD. NOc/BS, number of osteoclasts per mm bone surface; NOc/BAr, number of osteoclasts per mm2 bone area. P < 0.05 for both panels. (C) TRAP5b levels in the serum of 10- to 20-week-old female Nfatc1fl/fl and Nfatc1Δ/Δ mice (n = 8/genotype); P < 0.05. (D) TRAP stain and (E) TRAP assay of Nfatc1fl/fl and Nfatc1Δ/Δ M-CSF–primed BM cells cultured with osteoblasts (Obs) and Vitamin D3 (E) or Vitamin D3 and PGE2 (D and E). The data in E are the mean + SD of triplicate wells and representative of 2 independent experiments. (F) TRAP stain of Nfatc1fl/fl and Nfatc1Δ/Δ M-CSF–primed BM cells cultured with M-CSF or M-CSF and RANKL. (G) c-kit versus c-fms FACS plot of Nfatc1fl/fl and Nfatc1Δ/Δ BM cells gated on the CD11blo/–B220CD3ε population. (H) Quantification of osteoclast precursors in the BM of Nfatc1fl/fl and Nfatc1Δ/Δ mice. The data is the mean + SD (n = 5/genotype). (I) TRAP assay and (J) TRAP stain of Nfatc1fl/fl and Nfatc1Δ/Δ BMOcPs cultured with M-CSF or M-CSF and RANKL. The data in I is the mean + SD of triplicate wells and representative of more than 3 independent experiments. Original magnification, ×400 (A); ×100 (D, F, and J).
Figure 4
Figure 4. Comparative microarray analysis reveals 2 sets of NFATc1-regulated genes in osteoclasts.
(A) Microarray signal intensities for selected NFATc1-dependent mRNAs from Nfatc1fl/fl and Nfatc1Δ/Δ MROcPs. (B) qRT-PCR analysis for the expression of the NFATc1-dependent mRNAs identified in A in Nfatc1fl/fl and Nfatc1Δ/Δ BMOcPs stimulated with M-CSF or M-CSF and RANKL for 3 days. (C) Microarray signal intensities for selected NFATc1-augmented mRNAs from Nfatc1fl/fl and Nfatc1Δ/Δ MROcPs. (D) qRT-PCR analysis for the expression of the NFATc1-augmented mRNAs identified in C in Nfatc1fl/fl and Nfatc1Δ/Δ BMOcPs stimulated with M-CSF or M-CSF and RANKL for 3 days. (E) qRT-PCR analysis for the expression of the Nfatc1 mRNA isoforms in Nfatc1fl/fl and Nfatc1Δ/Δ BMOcPs stimulated with M-CSF or M-CSF and RANKL for 3 days. PCR primers targeted the deleted exon (Nfatc1ex3) or the Nfatc1/A isoform (see Table 1). Note that the qRT-PCR analyses presented in B, D, and E were performed on the same mRNA samples and are representative of at least 2 independent experiments. (F) qRT-PCR analysis for the expression of Nfatc1/A mRNA in NFATc2 sufficient (Nfatc2+/+) and deficient (Nfatc2–/–) Nfatc1fl/fl and Nfatc1Δ/Δ BMOcPs stimulated with M-CSF or M-CSF and RANKL for 4 days. The data in F are representative of at least 2 independent experiments.
Figure 5
Figure 5. RANKL induces Tnfrsf11b expression in the absence of NFATc1.
(A) Microarray signal intensities for Tnfrsf11b (upper panel) and Tnfrsf11a (lower panel) mRNAs from Nfatc1fl/fl (black bars) and Nfatc1Δ/Δ (white bars) MROcPs. (BD) qRT-PCR analysis for Tnfrsf11b mRNA in (B) Nfatc1fl/fl and Nfatc1Δ/Δ MROcPs or WT calvarial osteoblasts with or without Vitamin D3 and parathyroid hormone (PTH); (C) Nfatc1fl/fl (diamonds) and Nfatc1Δ/Δ (circles) BMOcPs stimulated with M-CSF and RANKL for 1, 2, or 4 days; and (D) Nfatc1fl/fl and Nfatc1Δ/Δ BMOcPs stimulated for 3 days with M-CSF or M-CSF and RANKL. (E) ELISA for OPG in the supernatants of Nfatc1fl/fl and Nfatc1Δ/Δ BMOcPs stimulated for 4 days with M-CSF or M-CSF and RANKL and for 2 days with M-CSF only. b.d., below detection. The data are the mean + SD of 4 independent wells. (F) qRT-PCR analysis for Tnfrsf11b and (G) Itgb3 mRNA in Nfatc1fl/fl BMOcPs stimulated with M-CSF and RANKL in the absence or presence of increasing concentrations of cyclosporine A (CsA) (62.5, 125, or 250 ng/ml CsA). The triangle under the x axis refers to increasing CsA concentrations. (H) NFATc1 ChIP of osteoclast precursors incubated with RANKL for 0, 1.5, or 3 days. Immunoprecipitated chromatin was analyzed by qRT-PCR for Tnfrsf11b promoter DNA, which was normalized to input. Data is the mean + SD of 2 independent experiments (*P < 0.05, **P = 0.053). (I) Relative luciferase (luc) activity of 293T cells transfected with pOPG 3.6-luc and increasing amounts of pMSCV-caNfatc1 (0, 8, 40, and 200 ng/transfection). The triangle under the x axis refers to increasing amounts of pMSCV-caNfatc1 per transfection. Data are the mean + SD of transfections performed in triplicate. The data in C and B, DG, and I are representative of 2 and 3 similar experiments, respectively.
Figure 6
Figure 6. NFATc1 uncouples bone loss from inflammation in a mouse model of cherubism.
(A) Anteroposterior digital radiograph of the femurs and tibias of 12-week-old female mice. White arrow denotes cystic changes at the distal tibia of Nfatc1fl/flKI/KI mice. Two other Nfatc1Δ/ΔKI/KI mice (1 mouse each at 12 and 17 weeks old) had a similar radiographic appearance to the Nfatc1Δ/ΔKI/KI sample displayed. (B) H&E stain of the liver and (C) lung of 12-week-old female mice. Black arrows in B and C indicate examples of inflammatory infiltrates. The original magnifications used to obtain the images are indicated above each column. The organ histology of Nfatc1fl/flKI/KI mice was identical to that previously described for mice bearing 2 KI alleles (3). A second Nfatc1Δ/ΔKI/KI mouse had similar histology to the Nfatc1Δ/ΔKI/KI sample displayed. (D) qRT-PCR analysis for the expression of Tnf mRNA in BM cells cultured for 5 days with 50 ng/ml M-CSF.
Figure 7
Figure 7. NFATc1 is downstream of SH3BP2 in osteoclastogenesis in vitro and in vivo.
(A) TRAP stain (original magnification, ×100) of BM cells incubated with 50 ng/ml M-CSF and 25 ng/ml RANKL for 4 days. (B and C) qRT-PCR analysis for the expression of the indicated genes in BM cells incubated with 50 ng/ml M-CSF and 25 ng/ml RANKL for 3 days. The data in AC is representative of 2 independent experiments. (D) Western blot analysis for NFATc1 and β-actin in BM cells incubated with 50 ng/ml M-CSF and 25 ng/ml RANKL for 3 days. (E) TRAP stain (original magnification, ×100) of the proximal humerus of 12-week-old female mice. The histology in E is representative of at least 3 Nfatc1Δ/ΔKI/KI mice.

References

    1. United States Department of Health and Human Services. 2004. Bone health and osteoporosis: a report of the Surgeon General. http://www.surgeongeneral.gov/library/bonehealth/content.html .
    1. Woolf A.D., Pfleger B. Burden of major musculoskeletal conditions. Bull. World Health Organ. 2003;81:646–656. - PMC - PubMed
    1. Ueki Y., et al. Increased myeloid cell responses to M-CSF and RANKL cause bone loss and inflammation in SH3BP2 “cherubism” mice. Cell. 2007;128:71–83. doi: 10.1016/j.cell.2006.10.047. - DOI - PubMed
    1. Goldring S.R., Gravallese E.M. Pathogenesis of bone erosions in rheumatoid arthritis. Curr. Opin. Rheumatol. 2000;12:195–199. doi: 10.1097/00002281-200005000-00006. - DOI - PubMed
    1. Wada T., Nakashima T., Hiroshi N., Penninger J.M. RANKL-RANK signaling in osteoclastogenesis and bone disease. Trends Mol. Med. 2006;12:17–25. doi: 10.1016/j.molmed.2005.11.007. - DOI - PubMed

Publication types