. 2008 Nov;118(11):3790-7.
doi: 10.1172/JCI36209. Epub 2008 Oct 9.

Real-time, multidimensional in vivo imaging used to investigate blood flow in mouse pancreatic islets

Affiliations

Real-time, multidimensional in vivo imaging used to investigate blood flow in mouse pancreatic islets

Lara R Nyman et al. J Clin Invest. 2008 Nov.

Abstract

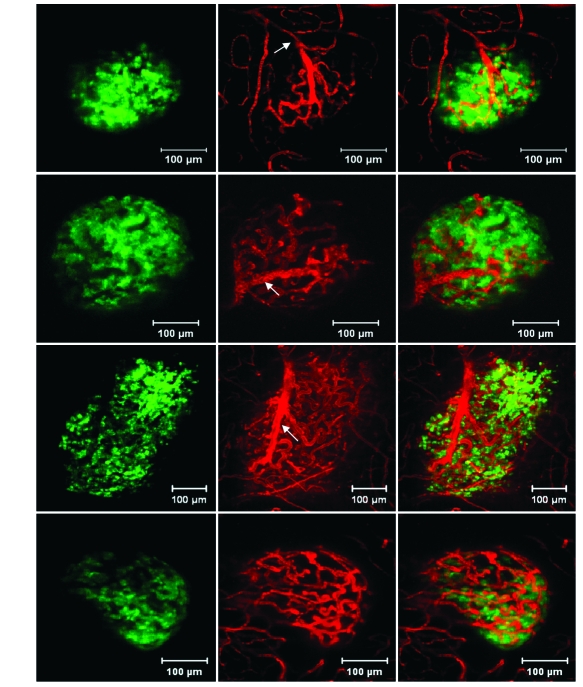
The pancreatic islets of Langerhans are highly vascularized micro-organs that play a key role in the regulation of blood glucose homeostasis. The specific arrangement of endocrine cell types in islets suggests a coupling between morphology and function within the islet. Here, we established a line-scanning confocal microscopy approach to examine the relationship between blood flow and islet cell type arrangement by real-time in vivo imaging of intra-islet blood flow in mice. These data were used to reconstruct the in vivo 3D architecture of the islet and time-resolved blood flow patterns throughout the islet vascular bed. The results revealed 2 predominant blood flow patterns in mouse islets: inner-to-outer, in which blood perfuses the core of beta cells before the islet perimeter of non-beta cells, and top-to-bottom, in which blood perfuses the islet from one side to the other regardless of cell type. Our approach included both millisecond temporal resolution and submicron spatial resolution, allowing for real-time imaging of islet blood flow within the living mouse, which has not to our knowledge been attainable by other methods.


Figures

Figure 1
Figure 1. Imaging islet blood flow in vivo.
(A) Schematic of in vivo imaging setup shows the positioning of an anesthetized MIP-GFP mouse with exteriorized pancreas over the lens of a high-speed, line-scanning confocal microscope. After epifluorescence visual identification of a GFP-labeled islet, rhodamine dextran was injected into the ocular plexus for visualization of islet blood in vivo. (B) Single-plane image of an islet with GFP-labeled β cells (green); islet vasculature was visualized with rhodamine dextran (red) tracer injection. Note the dark areas within vessels, reflecting red blood cells that were not labeled with the rhodamine dextran. Also note that the surrounding exocrine tissue had fewer vessels than the islet. Scale bar: 100 μm.
Figure 2
Figure 2. Variations in islet vascular structure in vivo.
Shown are 5 optical slices spaced 8–11 μm apart along the z direction for 4 different islets with rhodamine dextran–labeled plasma, demonstrating that vascular patterns differ in size and structure. The z position relative to the first image plane (nearest to the coverglass) of the islet is noted in microns, while the xy dimension is noted by 100-μm scale bars. (A) Medium islet, containing a large vessel with numerous capillaries coalescing into it in the top image planes (arrows). (B and C) Larger islets of different shapes, which also had large, arm-like vessels in the top 2 planes (arrows). (D) Islet not closely associated with an arm-like vessel. Image slices throughout the z plane showed vessel sizes to be mostly homogeneous in diameter, rather than having a graduated size pattern.
Figure 3
Figure 3. Through-focus projections of islets and their vasculature.
Shown are GFP-labeled β cells (left), the vasculature (middle), and the overlaid images (right) demonstrating the advantages of this visualization tool: making visible the full vascular tree in the islet, either in relation to the β cells or alone. Larger vessels were found to have multiple smaller vessels extending from the vessel (arrows). Scale bars: 100 μm.
Figure 4
Figure 4. Real-time assessment of directional patterns of blood flow in the islet.
Arrows denote vessel perfusion. (A) Time-resolved images (through-focus projection time series) showing the entry points of the rhodamine dextran (red) relative to the GFP-labeled β cells (green) after a bolus injection of dextran. The time of acquisition is shown for each frame. Tracer flowed into several smaller vessels within the islet before it appeared in the large vessel, shown most clearly in the last panel. (B) Time-resolved images showing vessel perfusion order of the rhodamine dextran (red) only (without the β cell mass), allowing for clear visualization of the sequential filling pattern of the vascular tree. These images further demonstrated that the largest vessel was not the first to be perfused and that blood entered first from 2 small arterioles. The last time point shows perfusion of this large vessel most clearly.
Figure 5
Figure 5. Temporal resolution analysis demonstrates more than 1 islet blood flow pattern.
(A and C) Two different islets (single-plane images), shown with inner (circles) and outer (squares) vessel regions selected and marked for fluorescence intensity measurement after a bolus of rhodamine dextran. Scale bars: 100 μm. (B and D) Average inner vessel fluorescent intensity time courses (throughout the z plane) compared with average outer vessel fluorescence intensity time course for the islets in A and C, respectively. Arrows denote rise times. Average rise time for the inner vessels was either (B) before that of outer vessels, as demonstrated by increased fluorescence intensity shown first by inner vessels, or (D) no different from outer vessels, which demonstrates that different islets had different perfusion patterns.
Figure 6
Figure 6. Quantification of islet perfusion patterns.
Vertical scatter plots show quantification of the initial fluorescence intensity rise time for inner (squares) and outer (triangles) vessels after rhodamine dextran bolus injection. (A) Representative islet in which mean rise time for inner vessels was prior to that for outer vessels (inner-to-outer). (B) Representative islet in which mean rise time was similar for inner and outer vessels (top-to-bottom). (C) Representative islet in which mean rise time for inner vessels was after that for outer vessels (outer-to-inner). (D) Number of islets demonstrating each perfusion pattern.

References

    1. Li X., et al. Islet microvasculature in islet hyperplasia and failure in a model of type 2 diabetes. Diabetes. 2006;55:2965–2973. doi: 10.2337/db06-0733. - DOI - PubMed
    1. Anneren C., Welsh M., Jansson L. Glucose intolerance and reduced islet blood flow in transgenic mice expressing the FRK tyrosine kinase under the control of the rat insulin promoter. Am. J. Physiol. Endocrinol. Metab. 2007;292:E1183–E1190. doi: 10.1152/ajpendo.00168.2006. - DOI - PubMed
    1. Svensson A.M., Ostenson C.G., Jansson L. Age-induced changes in pancreatic islet blood flow: evidence for an impaired regulation in diabetic GK rats. Am. J. Physiol. Endocrinol. Metab. 2000;279:E1139–E1144. - PubMed
    1. Jansson L., Carlsson P.O. Graft vascular function after transplantation of pancreatic islets. Diabetologia. 2002;45:749–763. doi: 10.1007/s00125-002-0827-4. - DOI - PubMed
    1. Brissova M., et al. Pancreatic islet production of vascular endothelial growth factor–a is essential for islet vascularization, revascularization, and function. Diabetes. 2006;55:2974–2985. doi: 10.2337/db06-0690. - DOI - PubMed

Publication types