

Proton-dependent electron transfer from CuA to heme a and altered EPR spectra in mutants close to heme a of cytochrome oxidase
- PMID: 18847227
- PMCID: PMC2659347
- DOI: 10.1021/bi801156s
Proton-dependent electron transfer from CuA to heme a and altered EPR spectra in mutants close to heme a of cytochrome oxidase
Abstract
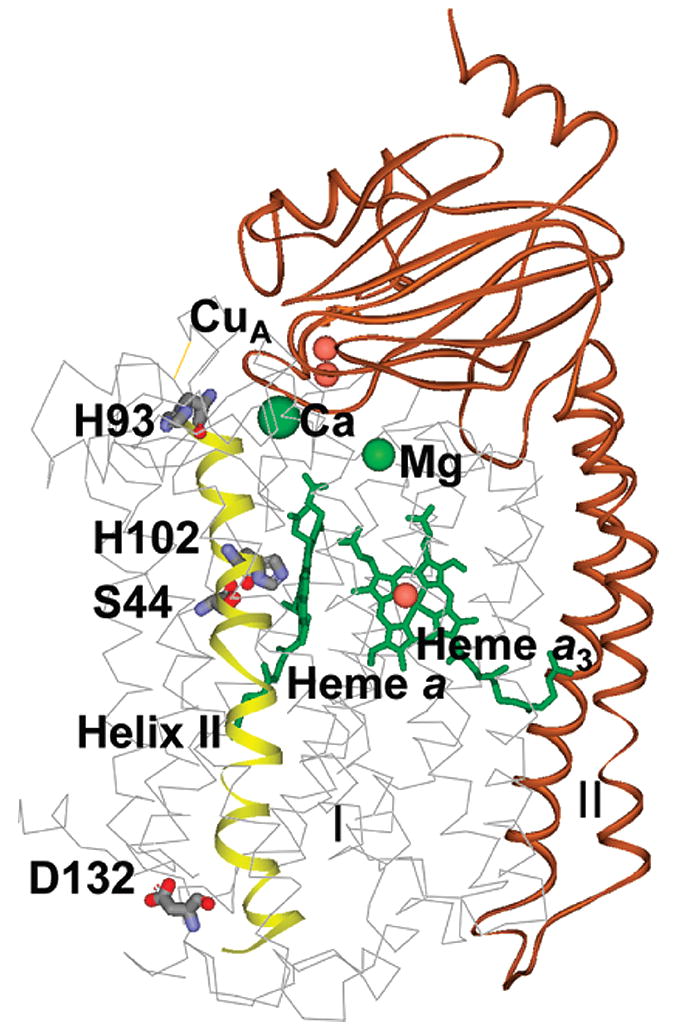
Eukaryotic cytochrome c oxidase (CcO) and homologous prokaryotic forms of Rhodobacter and Paraccocus differ in the EPR spectrum of heme a. It was noted that a histidine ligand of heme a (H102) is hydrogen bonded to serine in Rhodobacter (S44) and Paraccocus CcOs, in contrast to glycine in the bovine enzyme. Mutation of S44 to glycine shifts the heme a EPR signal from g(z) = 2.82 to 2.86, closer to bovine heme a at 3.03, without modifying other properties. Mutation to aspartate, however, results in an oppositely shifted and split heme a EPR signal of g(z) = 2.72/2.78, accompanied by lower activity and drastically inhibited intrinsic electron transfer from CuA to heme a. This intrinsic rate is biphasic; the proportion that is slow is pH dependent, as is the relative intensity of the two EPR signal components. At pH 8, the heme a EPR signal at 2.72 is most intense, and the electron transfer rate (CuA to heme a) is 10-130 s(-1), compared to wild-type at 90,000 s(-1). At pH 5.5, the signal at 2.78 is intensified, and a biphasic rate is observed, 50% fast (approximately wild type) and 50% slow (90 s(-1)). The data support the prediction that the hydrogen-bonding partner of the histidine ligand of heme a is one determinant of the EPR spectral difference between bovine and bacterial CcO. We further demonstrate that the heme a redox potential can be dramatically altered by a nearby carboxyl, whose protonation leads to a proton-coupled electron transfer process.
Figures


Similar articles
-
Mutants of the CuA site in cytochrome c oxidase of Rhodobacter sphaeroides: I. Spectral and functional properties.Biochemistry. 2002 Feb 19;41(7):2288-97. doi: 10.1021/bi0114628. Biochemistry. 2002. PMID: 11841221
-
Mutations in the putative H-channel in the cytochrome c oxidase from Rhodobacter sphaeroides show that this channel is not important for proton conduction but reveal modulation of the properties of heme a.Biochemistry. 2000 Mar 21;39(11):2989-96. doi: 10.1021/bi9924821. Biochemistry. 2000. PMID: 10715119
-
Blocking the K-pathway still allows rapid one-electron reduction of the binuclear center during the anaerobic reduction of the aa3-type cytochrome c oxidase from Rhodobacter sphaeroides.Biochim Biophys Acta. 2010 Jun-Jul;1797(6-7):619-24. doi: 10.1016/j.bbabio.2010.03.012. Epub 2010 Mar 20. Biochim Biophys Acta. 2010. PMID: 20307488 Free PMC article.
-
The use of stable isotopes and spectroscopy to investigate the energy transducing function of cytochrome c oxidase.Biochim Biophys Acta. 2004 Apr 12;1655(1-3):248-55. doi: 10.1016/j.bbabio.2003.11.008. Biochim Biophys Acta. 2004. PMID: 15100039 Review.
-
Site-directed mutagenesis studies on subunit I of the aa3-type cytochrome c oxidase of Rhodobacter sphaeroides: a brief review of progress to date.Biochim Biophys Acta. 1992 Jul 17;1101(2):184-7. Biochim Biophys Acta. 1992. PMID: 1378758 Review. No abstract available.
Cited by
-
Properties of Arg481 mutants of the aa3-type cytochrome c oxidase from Rhodobacter sphaeroides suggest that neither R481 nor the nearby D-propionate of heme a3 is likely to be the proton loading site of the proton pump.Biochemistry. 2009 Aug 4;48(30):7123-31. doi: 10.1021/bi901015d. Biochemistry. 2009. PMID: 19575527 Free PMC article.
-
Proton-coupled electron transfer.Chem Rev. 2007 Nov;107(11):5004-64. doi: 10.1021/cr0500030. Chem Rev. 2007. PMID: 17999556 Free PMC article. Review. No abstract available.
-
Pulsed electron spin resonance resolves the coordination site of Cu²(+) ions in α1-glycine receptor.Biophys J. 2010 Oct 20;99(8):2497-506. doi: 10.1016/j.bpj.2010.08.050. Biophys J. 2010. PMID: 20959090 Free PMC article.
-
Spectral identification of intermediates generated during the reaction of dioxygen with the wild-type and EQ(I-286) mutant of Rhodobacter sphaeroides cytochrome c oxidase.Biochemistry. 2012 Nov 20;51(46):9302-11. doi: 10.1021/bi301166u. Epub 2012 Nov 6. Biochemistry. 2012. PMID: 23057757 Free PMC article.
-
Electron transfer pathways in cytochrome c oxidase.Biochim Biophys Acta. 2011 Oct;1807(10):1305-13. doi: 10.1016/j.bbabio.2011.03.003. Epub 2011 Mar 16. Biochim Biophys Acta. 2011. PMID: 21419097 Free PMC article.
References
-
- Rich P, Meunier B, Mitchell R, Moody R. Coupling of charge and proton movement in cytochrome c oxidase. Biochim Biophys Acta. 1996;1275:91–95.
-
- Wikstrom M. How does cytochrome oxidase pump protons? A “cooperative proton pump” model. Ann NY Acad Sci. 1988;550:199–206. - PubMed
Publication types
MeSH terms
Substances
Grants and funding
LinkOut - more resources
Full Text Sources
