. 2008 Oct 10:8:280.
doi: 10.1186/1471-2148-8-280.

Unique genes in plants: specificities and conserved features throughout evolution

Affiliations

Unique genes in plants: specificities and conserved features throughout evolution

David Armisén et al. BMC Evol Biol. .

Abstract

Background: Plant genomes contain a high proportion of duplicated genes as a result of numerous whole, segmental and local duplications. These duplications lead up to the formation of gene families, which are the usual material for many evolutionary studies. However, all characterized genomes include single-copy (unique) genes that have not received much attention. Unlike gene duplication, gene loss is not an unspecific mechanism but is rather influenced by a functional selection. In this context, we have established and used stringent criteria in order to identify suitable sets of unique genes present in plant proteomes. Comparisons of unique genes in the green phylum were used to characterize the gene and protein features exhibited by both conserved and species-specific unique genes.

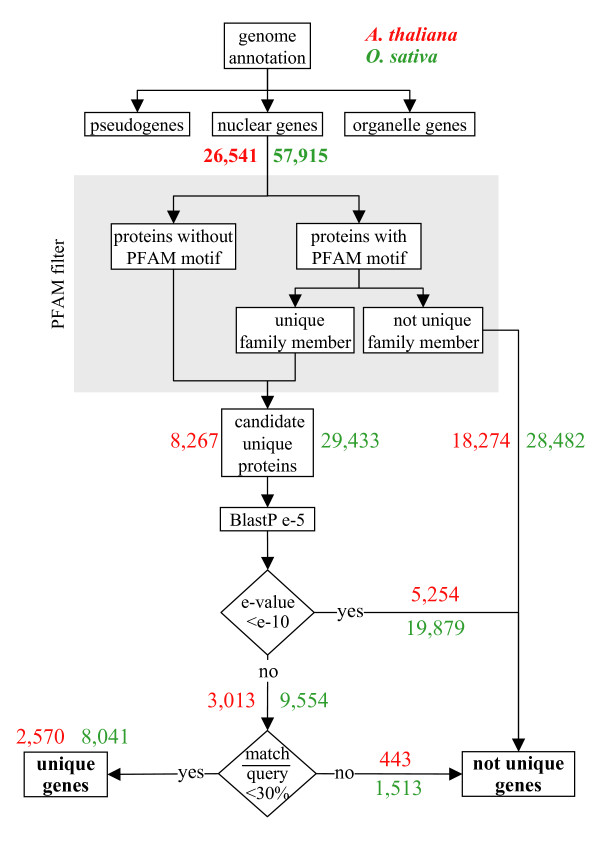
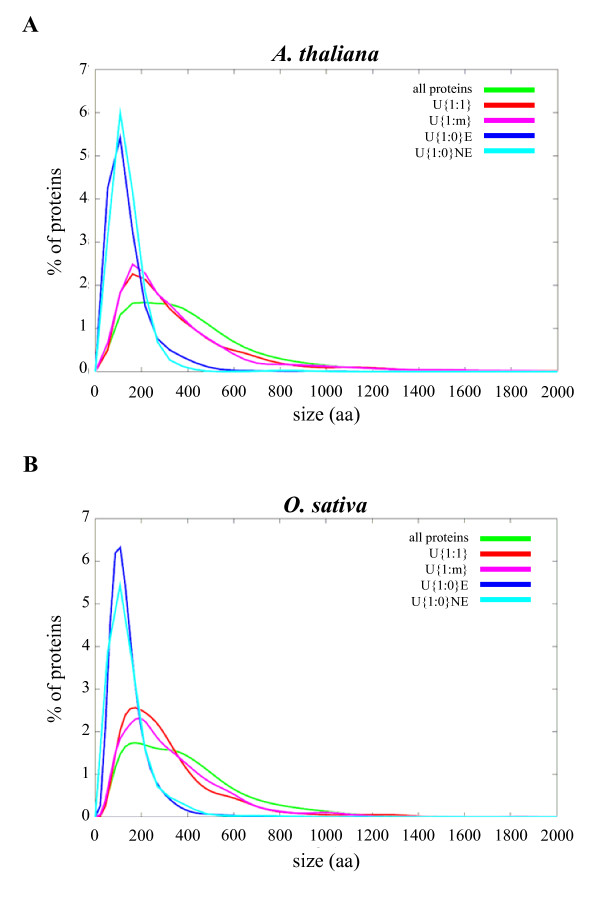
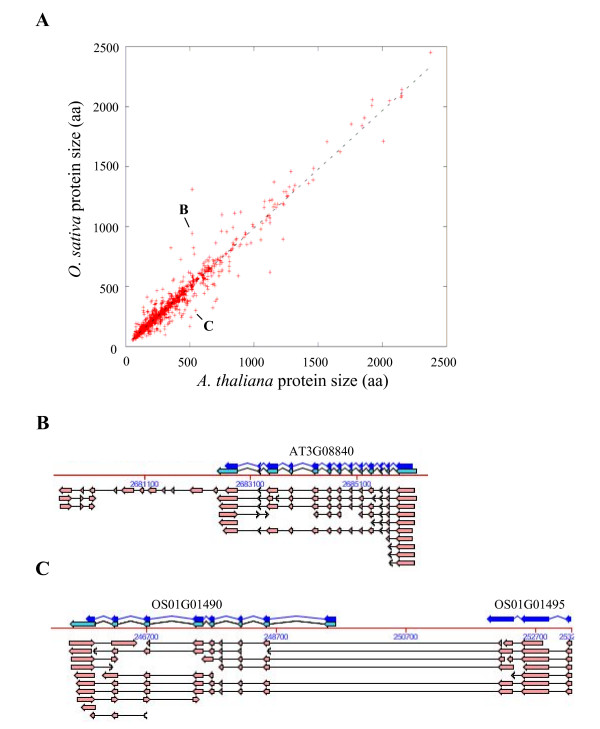
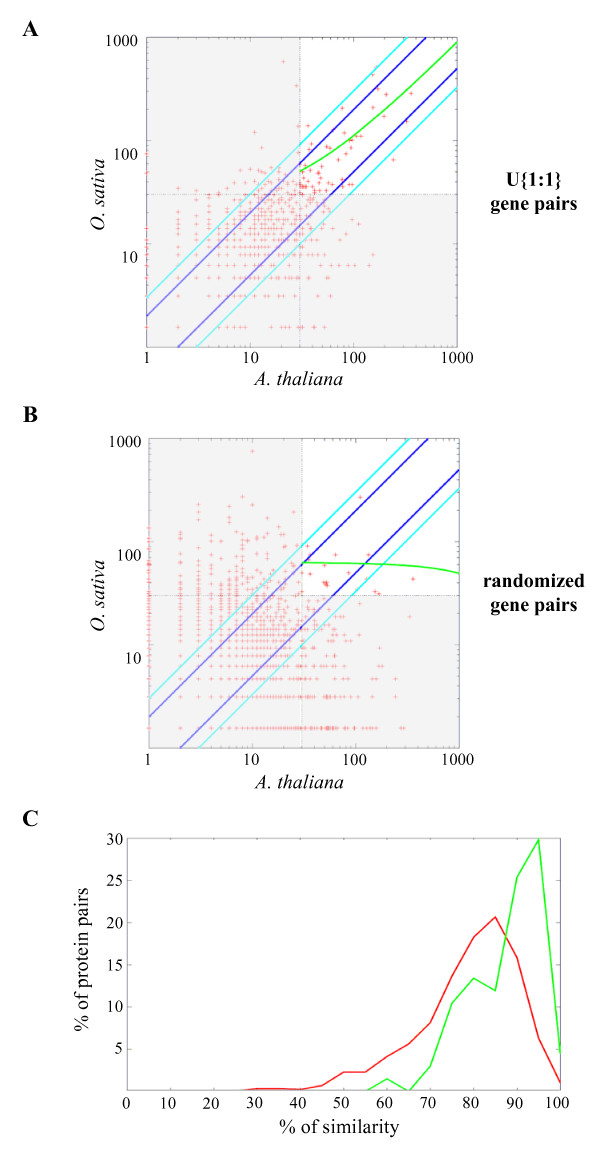
Results: We identified the unique genes within both A. thaliana and O. sativa genomes and classified them according to the number of homologs in the alternative species: none (U{1:0}), one (U{1:1}) or several (U{1:m}). Regardless of the species, all the genes in these groups present some conserved characteristics, such as small average protein size and abnormal intron number. In order to understand the origin and function of unique genes, we further characterized the U{1:1} gene pairs. The possible involvement of sequence convergence in the creation of U{1:1} pairs was discarded due to the frequent conservation of intron positions. Furthermore, an orthology relationship between the two members of each U{1:1} pair was strongly supported by a high conservation in the protein sizes and transcription levels. Within the promoter of the unique conserved genes, we found a number of TATA and TELO boxes that specifically differed from their mean number in the whole genome. Many unique genes have been conserved as unique through evolution from the green alga Ostreococcus lucimarinus to higher plants. Plant unique genes may also have homologs in bacteria and we showed a link between the targeting towards plastids of proteins encoded by plant nuclear unique genes and their homology with a bacterial protein.

Conclusion: Many of the A. thaliana and O. sativa unique genes are conserved in plants for which the ancestor diverged at least 725 million years ago (MYA). Half of these genes are also present in other eukaryotic and/or prokaryotic species. Thus, our results indicate that (i) a strong negative selection pressure has conserved a number of genes as unique in genomes throughout evolution, (ii) most unique genes are subjected to a low divergence rate, (iii) they have some features observed in housekeeping genes but for most of them there is no functional annotation and (iv) they may have an ancient origin involving a possible gene transfer from ancestral chloroplasts or bacteria to the plant nucleus.


Figures

Figure 1
Figure 1
Characterization of unique genes in A. thaliana and O. sativa. Schematic diagram describing the different filters applied to obtain the list of unique genes in each species. Only the proteins encoded by the nuclear genes were used. PFAM filter removed members of known families and BLASTp filters eliminated other genes with at least one homolog in the same genome. Results from A. thaliana genome are labelled in red while O. sativa results are in green.
Figure 2
Figure 2
Unique gene classification. Based on BLASTp sequence comparison, A. thaliana and O. sativa unique genes were classified according to the number of homologs in the other species. We named U{1:0} the unique proteins in one species with no homolog in the other one, U{1:1} the unique proteins with only one homolog and U{1:m} the unique proteins with more than one homolog. First, a BLASTp between unique protein in each species and the whole proteome of the other species was used to define U{1:0}, U{1:1} and U{1:m} gene groups. Proofs of transcription (presence of cognate ESTs and/or cDNA) were used for further classification of U{1:0} genes in U{1:0}E (for Expressed) and U{1:0}NE (for No proof of Expression) genes. Red numbers are relative to A. thaliana while green ones are relative to O. sativa.
Figure 3
Figure 3
Size distributions of proteins encoded by unique genes. The size distributions of different groups of proteins encoded by unique genes are compared in A. thaliana (A) and O. sativa (B). The reference 'all proteins' corresponds to every proteins encoded by the nuclear genes.
Figure 4
Figure 4
Comparison of protein lengths in U{1:1} pairs. Each point represents protein lengths (in aa) of one U{1:1} pair of proteins (A). The linear correlation between U{1:1} protein sizes is represented by a dotted line (r2 = 0.94). Hand-checking of the largest differences showed that they are mainly due to erroneous predicted gene models with either an artificial exon gain/loss as in AT3G08840 (B) or a splitting/fusion process as in OS01G01490-OS01G01495 (C). Arrows and lines represent exons and introns while dark blue, light blue and pink colours represent predicted CDS, predicted mRNA and cognate transcripts (ESTs/cDNA), respectively. (B) and (C) are snapshots from FLAGdb++ [90].
Figure 5
Figure 5
Expression levels correlated between genes of U{1:1} pairs. Expression level correlation based on the number of transcripts (ESTs/cDNA) associated to U{1:1} gene pairs (A) and randomized nuclear gene pairs (B). Values were first normalized to take into account the size of the transcript resources in each species, the number of genes with a transcript and the total number of genes on each species, and then transformed by base 10 logarithm. We used only the gene pairs with a size difference between proteins equal to or smaller than 20 aa (526 U{1:1} and 8,390 randomized pairs). The green line represents the linear correlation for pairs of genes with at least 30 cognate transcripts (white area). U{1:1} genes pairs: r2 = 0.51 and Kendall's test P-value = 1e-6; Random pairs sample: r2 = 0.03 and Kendall's test P-value = 0.26. Diagonal lines delimit an expression similarity of 33% (light blue) and 50% (dark blue). (C) Percentage of similarity was recovered from ClustalW alignments of U{1:1} protein pairs encoded by highly (green, more than 30 cognate transcripts) and lowly (red, less than 30 cognate transcripts) transcribed genes.
Figure 6
Figure 6
Unique gene conservation in the plant kingdom. Study of unique gene conservation through evolution of Arabidopsis thaliana (Brassicales), Oryza sativa (Poales), Physcomitrella patens (Funariaceae) and Ostreococcus lucimarinus (Prasinophyceae). Unique genes of each species were characterized (number below species name, total nuclear genes between brackets) and orthology relationships between couples of species were established using the previously described protocol. Phylogenetic conservation of unique genes was analysed from O. lucimarinus (orange line) and A. thaliana (blue line) discarding not conserved unique genes on each node (evolution distance showed in millions of years [28,29,74,78,79]. Remaining genes in each case were compared to eliminate inconsistencies and obtain a final list of 192 unique genes conserved as unique in the four species: U{1:1:1:1} genes. These 192 conserved unique genes are far more than the 8.38 U{1:1:1:1} genes expected by random conservation (black dashed line).

Similar articles

Cited by

References

    1. Taylor JS, Raes J. Duplication and divergence: the evolution of new genes and old ideas. Annu Rev Genet. 2004;38:615–643. doi: 10.1146/annurev.genet.38.072902.092831. - DOI - PubMed
    1. Tekaia F, Dujon B. Pervasiveness of gene conservation and persistence of duplicates in cellular genomes. J Mol Evol. 1999;49(5):591–600. doi: 10.1007/PL00006580. - DOI - PubMed
    1. Wapinski I, Pfeffer A, Friedman N, Regev A. Natural history and evolutionary principles of gene duplication in fungi. Nature. 2007;449(7158):54–61. doi: 10.1038/nature06107. - DOI - PubMed
    1. The Arabidopsis Genome Initiative. Analysis of the genome sequence of the flowering plant Arabidopsis thaliana. Nature. 2000;408(6814):796–815. doi: 10.1038/35048692. - DOI - PubMed
    1. Yu J, Hu S, Wang J, Wong GK, Li S, Liu B, Deng Y, Dai L, Zhou Y, Zhang X. et al.A draft sequence of the rice genome (Oryza sativa L. ssp. indica) Science. 2002;296(5565):79–92. doi: 10.1126/science.1068037. - DOI - PubMed

Publication types

LinkOut - more resources