

Global analysis of gene expression changes during retinoic acid-induced growth arrest and differentiation of melanoma: comparison to differentially expressed genes in melanocytes vs melanoma
- PMID: 18847503
- PMCID: PMC2572629
- DOI: 10.1186/1471-2164-9-478
Global analysis of gene expression changes during retinoic acid-induced growth arrest and differentiation of melanoma: comparison to differentially expressed genes in melanocytes vs melanoma
Abstract
Background: The incidence of malignant melanoma has significantly increased over the last decade. Some of these malignancies are susceptible to the growth inhibitory and pro-differentiating effects of all-trans-retinoic acid (RA). The molecular changes responsible for the biological activity of RA in melanoma are not well understood.
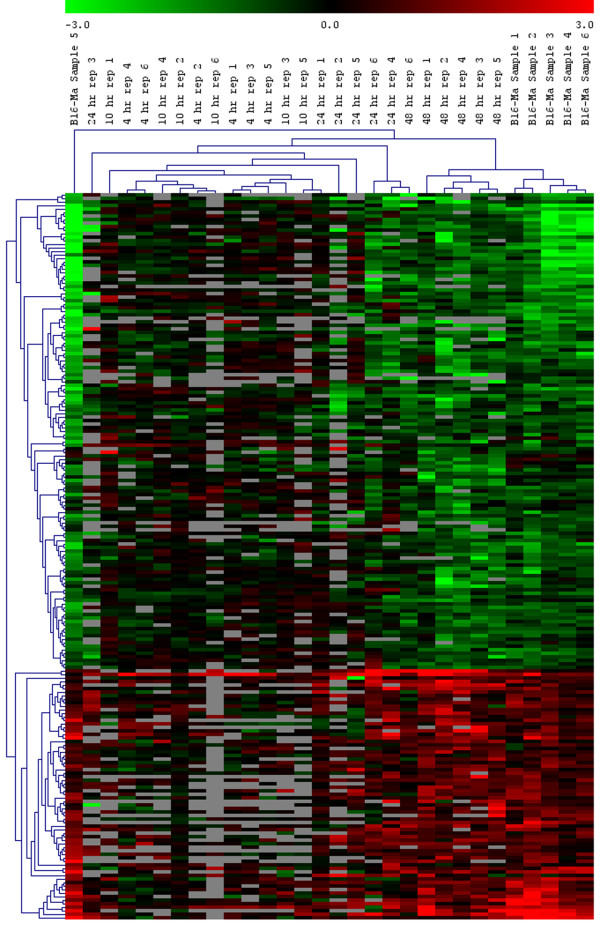
Results: In an analysis of sequential global gene expression changes during a 4-48 h RA treatment of B16 mouse melanoma cells, we found that RA increased the expression of 757 genes and decreased the expression of 737 genes. We also compared the gene expression profile (no RA treatment) between non-malignant melan-a mouse melanocytes and B16 melanoma cells. Using the same statistical test, we found 1495 genes whose expression was significantly higher in melan-a than in B16 cells and 2054 genes whose expression was significantly lower in melan-a than in B16 cells. By intersecting these two gene sets, we discovered a common set of 233 genes whose RNA levels were significantly different between B16 and melan-a cells and whose expression was altered by RA treatment. Within this set, RA treatment altered the expression of 203 (87%) genes toward the melan-a expression level. In addition, hierarchical clustering showed that after 48 h of RA treatment expression of the 203 genes was more closely related to the melan-a gene set than any other RA treatment time point. Functional analysis of the 203 gene set indicated that RA decreased expression of mRNAs that encode proteins involved in cell division/cell cycle, DNA replication, recombination and repair, and transcription regulation. Conversely, it stimulated genes involved in cell-cell signaling, cell adhesion and cell differentiation/embryonic development. Pathway analysis of the 203 gene set revealed four major hubs of connectivity: CDC2, CHEK1, CDC45L and MCM6.
Conclusion: Our analysis of common genes in the 48 h RA-treatment of B16 melanoma cells and untreated B16 vs. melan-a data set show that RA "normalized" the expression of genes involved in energy metabolism, DNA replication, DNA repair and differentiation. These results are compatible with the known growth inhibitory and pro-differentiating effects of RA. Pathway analysis suggests that CDC2, CHEK1, CDC45L and MCM6 are key players in mediating the biological activity of RA in B16 melanoma cells.
Figures

Similar articles
-
Retinoic acid-induced AP-1 transcriptional activity regulates B16 mouse melanoma growth inhibition and differentiation.J Cell Physiol. 2003 Feb;194(2):162-70. doi: 10.1002/jcp.10199. J Cell Physiol. 2003. PMID: 12494454
-
The effect of white light on normal and malignant murine melanocytes: A link between opsins, clock genes, and melanogenesis.Biochim Biophys Acta. 2016 Jun;1863(6 Pt A):1119-33. doi: 10.1016/j.bbamcr.2016.03.001. Epub 2016 Mar 3. Biochim Biophys Acta. 2016. PMID: 26947915
-
Differentiation-inducing and anti-proliferative activities of isoliquiritigenin and all-trans-retinoic acid on B16F0 melanoma cells: Mechanisms profiling by RNA-seq.Gene. 2016 Oct 30;592(1):86-98. doi: 10.1016/j.gene.2016.07.052. Epub 2016 Jul 25. Gene. 2016. PMID: 27461947
-
T-box binding protein type two (TBX2) is an immediate early gene target in retinoic-acid-treated B16 murine melanoma cells.Exp Cell Res. 2004 May 1;295(2):281-9. doi: 10.1016/j.yexcr.2003.12.017. Exp Cell Res. 2004. PMID: 15093729
-
Vitamin A (retinoids) regulation of mouse melanoma growth and differentiation.J Nutr. 2003 Jan;133(1):282S-286S. doi: 10.1093/jn/133.1.282S. J Nutr. 2003. PMID: 12514310 Review.
Cited by
-
Pharmacoepigenomics circuits induced by a novel retinoid-polyamine conjugate in human immortalized keratinocytes.Pharmacogenomics J. 2021 Dec;21(6):638-648. doi: 10.1038/s41397-021-00241-9. Epub 2021 Jun 18. Pharmacogenomics J. 2021. PMID: 34145402
-
Density based pruning for identification of differentially expressed genes from microarray data.BMC Genomics. 2010 Nov 2;11 Suppl 2(Suppl 2):S3. doi: 10.1186/1471-2164-11-S2-S3. BMC Genomics. 2010. PMID: 21047384 Free PMC article.
-
Plant lectin can target receptors containing sialic acid, exemplified by podoplanin, to inhibit transformed cell growth and migration.PLoS One. 2012;7(7):e41845. doi: 10.1371/journal.pone.0041845. Epub 2012 Jul 23. PLoS One. 2012. PMID: 22844530 Free PMC article.
-
Cancer biomarker discovery: the entropic hallmark.PLoS One. 2010 Aug 18;5(8):e12262. doi: 10.1371/journal.pone.0012262. PLoS One. 2010. PMID: 20805891 Free PMC article.
-
Pharmacological EZH2 inhibition combined with retinoic acid treatment promotes differentiation and apoptosis in rhabdomyosarcoma cells.Clin Epigenetics. 2023 Oct 19;15(1):167. doi: 10.1186/s13148-023-01583-w. Clin Epigenetics. 2023. PMID: 37858275 Free PMC article.
References
Publication types
MeSH terms
Substances
Grants and funding
LinkOut - more resources
Full Text Sources
Medical
Molecular Biology Databases
Research Materials
Miscellaneous
