. 2008 Nov 20;456(7220):391-4.
doi: 10.1038/nature07382. Epub 2008 Oct 5.

Guarding the gateway to cortex with attention in visual thalamus

Affiliations

Guarding the gateway to cortex with attention in visual thalamus

Kerry McAlonan et al. Nature. .

Abstract

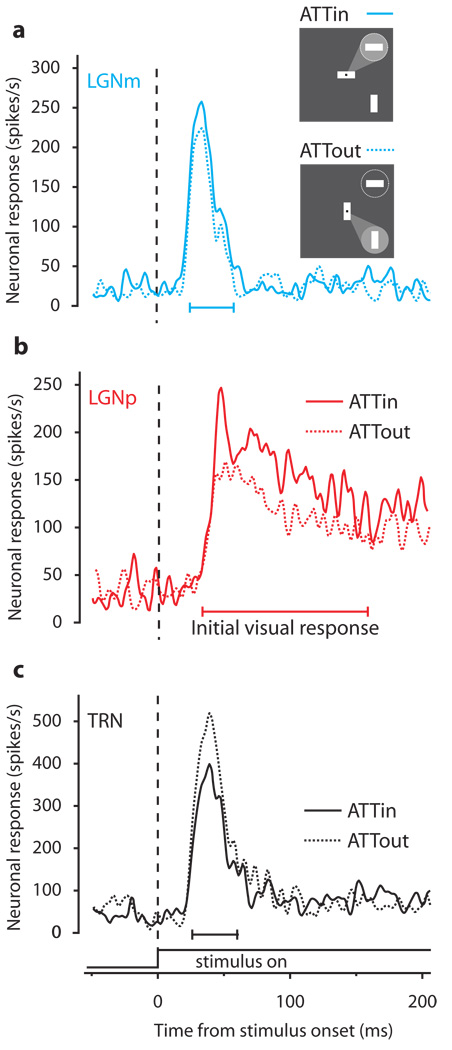
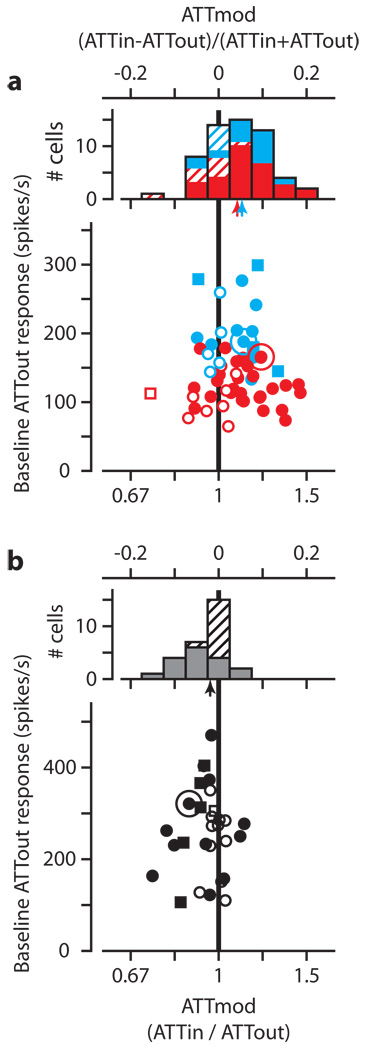
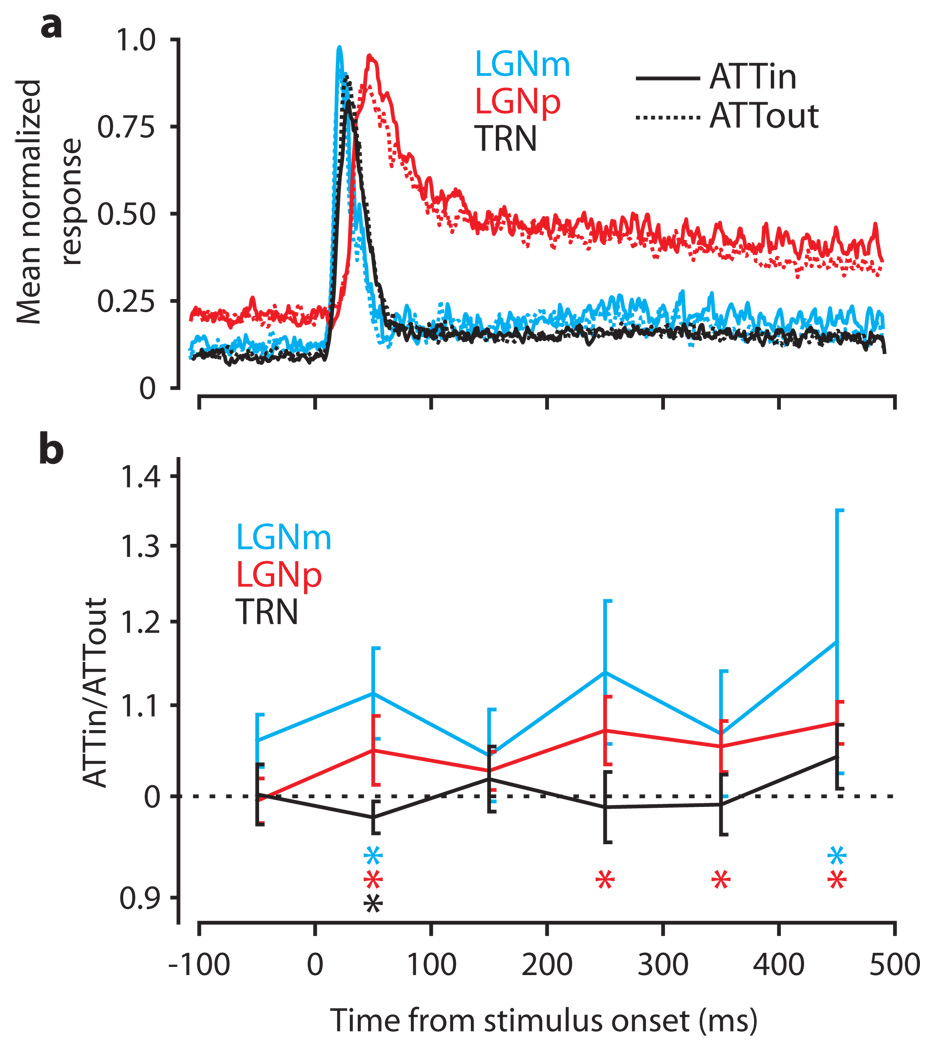
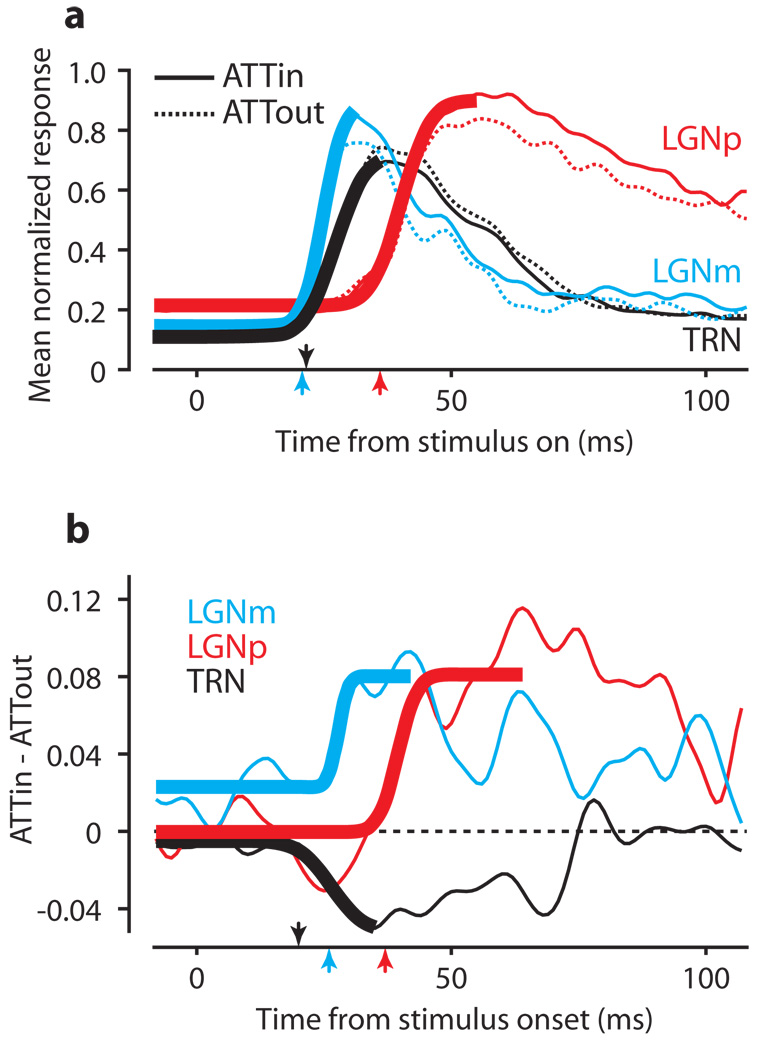
The massive visual input from the eye to the brain requires selective processing of some visual information at the expense of other information, a process referred to as visual attention. Increases in the responses of visual neurons with attention have been extensively studied along the visual processing streams in monkey cerebral cortex, from primary visual areas to parietal and frontal cortex. Here we show, by recording neurons in attending macaque monkeys (Macaca mulatta), that attention modulates visual signals before they even reach cortex by increasing responses of both magnocellular and parvocellular neurons in the first relay between retina and cortex, the lateral geniculate nucleus (LGN). At the same time, attention decreases neuronal responses in the adjacent thalamic reticular nucleus (TRN). Crick argued for such modulation of the LGN by observing that it is inhibited by the TRN, and suggested that "if the thalamus is the gateway to the cortex, the reticular complex might be described as the guardian of the gateway", a reciprocal relationship we now show to be more than just hypothesis. The reciprocal modulation in LGN and TRN appears only during the initial visual response, but the modulation of LGN reappears later in the response, suggesting separate early and late sources of attentional modulation in LGN.


Figures

Figure 1
Figure 1
Sample responses to shifts of attention in LGN and TRN. Solid traces are spike density plots of the neuron’s ATTin response (as illustrated by the “spotlight” of attention in the inset cartoon directed to the circle representing the RF). Dashed traces are ATTout responses. Responses are aligned to stimulus onset (the dashed vertical line), and have been smoothed with a Gaussian window of 2 ms SD. a, Responses of sample magnocellular LGN neuron (LGNm). b, Responses of sample parvocellular LGN neuron (LGNp). c, Responses of sample TRN neuron.
Figure 2
Figure 2
Effect of attention on LGN and TRN. a, Scatterplot showing mean baseline ATTout response versus attentional modulation (ATTmod) for 19 LGNm neurons (blue) and 38 LGNp neurons (red). Solid symbols are significant response changes (Wilcoxon rank-sum test, p<0.01). Squares denote experiments in which performance did not guarantee attention (see full Methods section). Distributions of ATTmod appear above the scatterplots. Hatched areas of each bar denote changes that did not reach significance. Arrows show median ATTmod for LGNm (blue) and LGNp (red). b, Similar scatterplot and histogram for TRN. In all plots, the larger circles indicate the Figure 1 example neurons.
Figure 3
Figure 3
Time courses of visual and attentional influences. a, Mean normalized ATTin (solid curves) and ATTout (dashed curves) responses for each area. Each curve is the mean normalized spike density plot over all neurons in an area. Mean responses have been smoothed with a Gaussian kernel of 2.8 ms SD. b, Median effect of attention on each area in 100 ms epochs. Each trace shows ATTmod over time. Error bars are ± 1 SE of the median. Significant changes in each epoch are denoted by colored asterisks coded to each area below the curves.
Figure 4
Figure 4
Latencies of visual and attentional influences. a, First 100 ms of the visual responses from Figure 3a. Thick lines are sample descriptive fits to ATTin responses from the bootstrap analysis. Arrows indicate median visual latencies. b, Latency of attentional effect in each area. Each trace shows the difference between the mean ATTin and ATTout responses. Thick lines show sample descriptive fits used to extract latency estimates in the bootstrap analysis. Arrows indicate the median latencies for the effect of attention.

References

    1. Desimone R, Duncan J. Neural mechanisms of selective visual attention. Annu Rev Neurosci. 1995;18:193–222. - PubMed
    1. Maunsell JH, Cook EP. The role of attention in visual processing. Philos Trans R Soc Lond B Biol Sci. 2002;357:1063–1072. - PMC - PubMed
    1. McAdams CJ, Maunsell JH. Effects of attention on the reliability of individual neurons in monkey visual cortex. Neuron. 1999;23:765–773. - PubMed
    1. Reynolds JH, Chelazzi L. Attentional modulation of visual processing. Annu Rev Neurosci. 2004;27:611–647. - PubMed
    1. Crick F. Function of the thalamic reticular complex: the searchlight hypothesis. Proc Natl Acad Sci U S A. 1984;81:4586–4590. - PMC - PubMed

Publication types