

Review
doi: 10.1007/s00439-008-0568-7.
Epub 2008 Oct 11.
Missing data imputation and haplotype phase inference for genome-wide association studies
Affiliations
- PMID: 18850115
- PMCID: PMC2731769
- DOI: 10.1007/s00439-008-0568-7
Item in Clipboard
Review
Missing data imputation and haplotype phase inference for genome-wide association studies
Hum Genet.
2008 Dec.
Abstract
Imputation of missing data and the use of haplotype-based association tests can improve the power of genome-wide association studies (GWAS). In this article, I review methods for haplotype inference and missing data imputation, and discuss their application to GWAS. I discuss common features of the best algorithms for haplotype phase inference and missing data imputation in large-scale data sets, as well as some important differences between classes of methods, and highlight the methods that provide the highest accuracy and fastest computational performance.
Figures
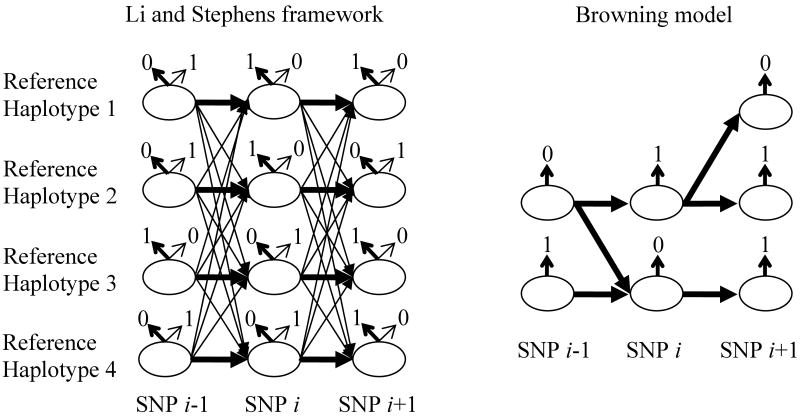
Illustration highlighting major differences between models based on the Li and Stephens framework (2003) and the Browning model (Browning 2006). Excerpts of the models covering three markers (SNPs i-1, i and i+1) are shown. Ovals are hidden states of the models. For the Li and Stephens framework, these states are defined by the reference haplotypes, while for the Browning model the states are localized clusters of haplotypes. Note that the graphical representation of the Browning model is that given in Browning (2008), while earlier representations had states as edges rather than as nodes of the graph. The Browning model will tend to have fewer states at any given marker than will unconstrained models based on the Li and Stephens framework, and the number of states can vary from marker to marker for the Browning model but is fixed in the Li and Stephens framework. Arrows between states from one SNP to the next are transitions of the HMM. For the Li and Stephens framework, transitions with highest prior probability (those seen in the reference haplotypes) are shown with bold arrows, while thin arrows allow for historical recombination. For the Browning model, there are at most k transitions coming out of a state, where k is the number of alleles at the next marker (i.e. 2 for SNPs), which helps to keep the model parsimonious. Arrows coming out of the top of the states are possible emissions of the HMM, which are the observed alleles. For the Li and Stephens framework, emissions with highest prior probability (the alleles on the reference haplotypes) are shown with bold arrows, while thin arrows represent mutations to other alleles. The reference haplotypes here are 011, 010, 101 and 001. For the Browning model, there is only one possible emission from each state, which helps to keep the model parsimonious. The models shown are illustrative only. The actual form of the Browning model will vary depending on the alleles of the reference haplotypes outside this window of markers.
References
-
- Altshuler D, Daly M. Guilt beyond a reasonable doubt. Nat Genet. 2007;39:813–5. - PubMed
-
- Ayers KL, Sabatti C, Lange K. A dictionary model for haplotyping, genotype calling, and association testing. Genetic Epidemiology. 2007;31:672–683. - PubMed
-
- Balding DJ. A tutorial on statistical methods for population association studies. Nat Rev Genet. 2006;7:781–91. - PubMed
-
- Barrett JC, Hansoul S, Nicolae DL, Cho JH, Duerr RH, Rioux JD, Brant SR, Silverberg MS, Taylor KD, Barmada MM, Bitton A, Dassopoulos T, Datta LW, Green T, Griffiths AM, Kistner EO, Murtha MT, Regueiro MD, Rotter JI, Schumm LP, Steinhart AH, Targan SR, Xavier RJ, Libioulle C, Sandor C, Lathrop M, Belaiche J, Dewit O, Gut I, Heath S, Laukens D, Mni M, Rutgeerts P, Van Gossum A, Zelenika D, Franchimont D, Hugot JP, de Vos M, Vermeire S, Louis E, Cardon LR, Anderson CA, Drummond H, Nimmo E, Ahmad T, Prescott NJ, Onnie CM, Fisher SA, Marchini J, Ghori J, Bumpstead S, Gwilliam R, Tremelling M, Deloukas P, Mansfield J, Jewell D, Satsangi J, Mathew CG, Parkes M, Georges M, Daly MJ. Genome-wide association defines more than 30 distinct susceptibility loci for Crohn's disease. Nat Genet. 2008;40:955–62. - PMC - PubMed
Publication types
MeSH terms
Substances
Grants and funding
LinkOut - more resources
Full Text Sources
Other Literature Sources
