. 2008 Aug;36(1-4):101-18.
doi: 10.1007/s11068-008-9031-x. Epub 2008 Oct 11.

Imaging synaptic inhibition throughout the brain via genetically targeted Clomeleon

Affiliations

Imaging synaptic inhibition throughout the brain via genetically targeted Clomeleon

Ken Berglund et al. Brain Cell Biol. 2008 Aug.

Abstract

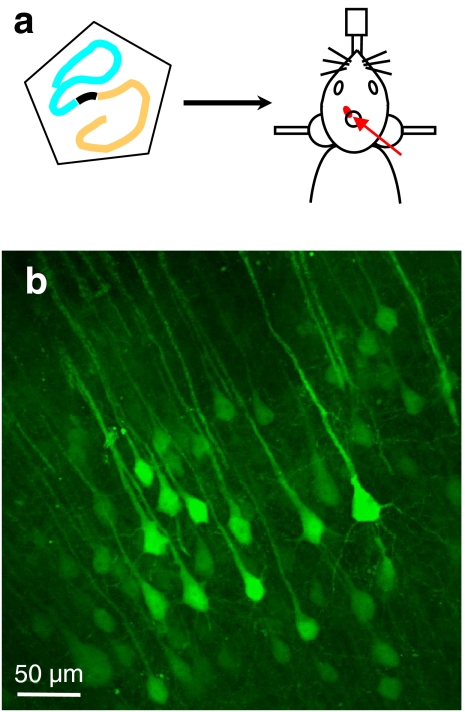
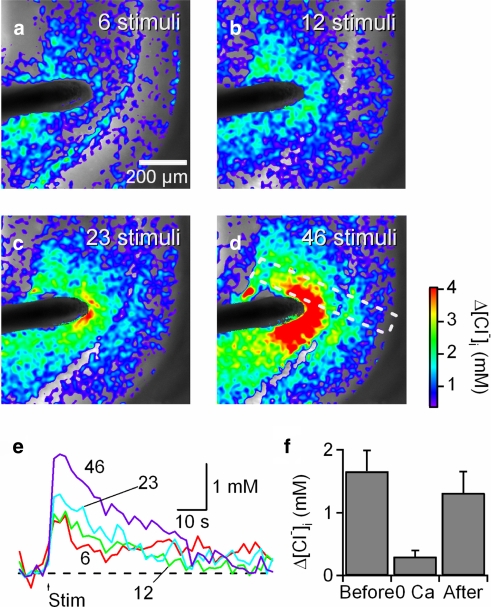
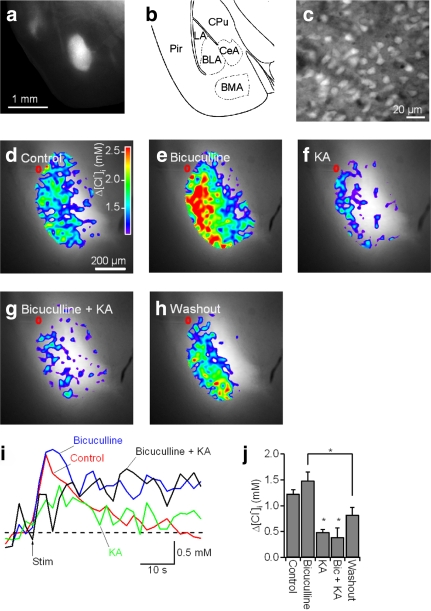
Here we survey a molecular genetic approach for imaging synaptic inhibition. This approach is based on measuring intracellular chloride concentration ([Cl(-)](i)) with the fluorescent chloride indicator protein, Clomeleon. We first describe several different ways to express Clomeleon in selected populations of neurons in the mouse brain. These methods include targeted viral gene transfer, conditional expression controlled by Cre recombination, and transgenesis based on the neuron-specific promoter, thy1. Next, we evaluate the feasibility of using different lines of thy1::Clomeleon transgenic mice to image synaptic inhibition in several different brain regions: the hippocampus, the deep cerebellar nuclei (DCN), the basolateral nucleus of the amygdala, and the superior colliculus (SC). Activation of hippocampal interneurons caused [Cl(-)](i) to rise transiently in individual postsynaptic CA1 pyramidal neurons. [Cl(-)](i) increased linearly with the number of electrical stimuli in a train, with peak changes as large as 4 mM. These responses were largely mediated by GABA receptors because they were blocked by antagonists of GABA receptors, such as GABAzine and bicuculline. Similar responses to synaptic activity were observed in DCN neurons, amygdalar principal cells, and collicular premotor neurons. However, in contrast to the hippocampus, the responses in these three regions were largely insensitive to antagonists of inhibitory neurotransmitter receptors. This indicates that synaptic activity can also cause Cl(-) influx through alternate pathways that remain to be identified. We conclude that Clomeleon imaging permits non-invasive, spatiotemporally precise recordings of [Cl(-)](i) in a large variety of neurons, and provides new opportunities for imaging synaptic inhibition and other forms of neuronal chloride signaling.


Figures

Fig. 1
Fig. 1
Stereotaxic delivery of AAV1/2-Clomeleon (a) AAV1/2 containing Clomeleon transgene (left) was delivered to the neocortex of a mouse mounted on a stereotaxic device (right). (b) Clomeleon expression in neocortical layer 5 neurons. Projection of an image stack obtained with confocal microscopy of aldehyde-fixed tissue
Fig. 2
Fig. 2
Differential expression of Clomeleon in CLM lines (a) The thy1 gene and Clomeleon cassette. Clomeleon consists of cyan fluorescent protein (CFP), a linker of 24 amino acid residues (gray), and the yellow fluorescent protein (YFP) Topaz. Partial schematic structure of the thy1 gene is shown with exons labeled in roman numerals. (b–d) Clomeleon expression in thy1::Clomeleon mice lines CLM11 (b), CLM12 (c), CLM13 (d). Adapted from Berglund et al. (2006). The diagram (bottom) was adapted from Paxinos and Franklin (2001)
Fig. 3
Fig. 3
Clomeleon expression on the cellular level in thy1::Clomeleon mice (a–c) Expression in the hippocampus. (a) hilus, (b) dentate gyrus, (c) CA1 area. Confocal microscopic images of aldehyde-fixed tissue. Reproduced from Berglund et al. (2006). (d) Neocortical layer 5 (L5) neurons were reconstructed from serial images obtained from the brain surface (L1) with in vivo two-photon microscopy (in collaboration with Fritjof Helmchen, Max-Planck-Institute for Medical Research)
Fig. 4
Fig. 4
UniAct-Clomeleon mouse line (a) ROSA26 promoter and transcriptional stop cassette (SA, neo, and 4x pA) flanked by loxP sites (top). In cells expressing Cre under a cell type-specific promoter (center), Clomeleon (CFP in blue and YFP in yellow) expression is activated (bottom). (b) Principle of universally activatable indicator mouse lines with Cre mouse lines with different promoters, such as CMVm (CMVm-Cre), Ca2+/calmodulin dependent kinase (CamK-Cre), Ksp-cadherin (Ksp1.3-Cre), and albumin (albumin-Cre). (c) Mating a UniAct-Clomeleon mouse with a GnRH-Cre mouse resulted in Clomeleon expression (left) in hypothalamic GnRH neurons as shown in immunostaining against GnRH (right)
Fig. 5
Fig. 5
Clomeleon expression by combination of adenovirus and Cre recombinase technique (a) Structure of STOPflox-Clomeleon, which was integrated into AAV1/2. (b) Stereotaxic injection of AAV1/2-STOPflox-Clomeleon into a CaMKII-Cre mouse resulted in Clomeleon expression in neocortical layer 5 neurons. A wide-field epifluorescence image was obtained in live slice preparation
Fig. 6
Fig. 6
Cl transients elicited by synaptic stimulation in the hippocampal CA1 (a–d) Images showing Cl changes (pseudo-color) superimposed on YFP fluorescence (gray scale) measured in CLM1 hippocampal slice (P16). The slice was oriented so that the stratum lacunosum-moleculare/radiatum (apical dendrites) is to the left, the stratum pyramidale (somata) is at the center, and the stratum oriens (basal dendrites) is to the right. A train of brief electrical stimuli (800 μA; 23 Hz) was delivered by the electrode (black) for 250 ms (6 stimuli, a), for 500 ms (12 stimuli, b), for 1 s (23 stimuli, c), and 2 s (46 stimuli, d). Cl was imaged every 2 s and repeated 4 times for each duration for averaging. The region within the white dotted rectangle was used for further analysis in Fig. 7. (e) Changes in [Cl]i averaged over the whole CA1 in the field shown in a-d. The arrow (Stim) depicts the onset of electrical stimulation. (f) Reversible decrease of Cl response in nominally Ca2+-free solution. The duration of the train was 1 s (23 stimuli). Mean ± SEM of six experiments. Reproduced from Berglund et al. (2006)
Fig. 7
Fig. 7
Spatiotemporal profiles of Cl transients (a) A line-scan of [Cl]i changes across the layers of CA1. The area of analysis is indicated by the white dotted rectangle in Fig. 6d and resting [Cl]i before stimulation was subtracted to show relative changes caused by stimulation (at arrow). A white rectangle on the ordinate denotes the size and the position of the stimulating electrode. (b) Changes in [Cl]i calculated from each layer. Trace colors correspond to those of labels in a. Duration of 2 s stimulus train is depicted as a line (Stim). (c) Peak magnitude of [Cl]i changes in the four compartments of pyramidal cells in each layer. Mean ± SEM of seven experiments. * denotes a significant difference from the rest by ANOVA followed by Newman–Keuls test (*P < 0.05). (d) Time to peak of [Cl]i changes in the same four compartments of pyramidal cells. * denotes a significant difference, as determined by ANOVA followed by Newman–Keuls test (*P < 0.05). Reproduced from Berglund et al. (2006)
Fig. 8
Fig. 8
Clomeleon response in DCN (a) Clomeleon was expressed in the medial (Med), the anterior (IntA), and the posterior part (IntP) of the interposed nuclei. A sagittal section was cut from CLM1 cerebellum. Note robust expression of Clomeleon in granule cells in the cerebellar cortex. (b) Clomeleon was expressed in large and round cells, indicative of glutamatergic principal cells, in the lateral nucleus of the cerebellum of CLM1. (c) Electrical stimulation to the corticonuclear tract in the 8th lobule (dotted red lines) elicited [Cl]i increase in the posterior interposed nucleus. Four images were photomontaged to generate a raw YFP-fluorescent image in gray scale. For [Cl]i change during stimulation shown in pseudo-color scale, only the lower-left quadrant was imaged. The image shown was acquired right after the stimulus. The experiment was done in P18 CLM13 mouse, which lacked granule cell expression. (d) Time course of [Cl]i changes shown in c before (Control), during GABAzine and strychnine (SR + strychnine), and during kynurenic acid (KA) application. The arrow (Stim) depicts the onset of electrical stimulation (140-μA pulses at 100 Hz for 6 s). Average of three trials in each condition
Fig. 9
Fig. 9
Clomeleon response in the basolateral nucleus of the amygdala (a) A coronal section from CLM1 showing Clomeleon expression in the basolateral nucleus of the amygdala. (b) A diagram showing the amygdaloid complex. LA: the lateral nucleus, BLA: the basolateral nucleus, BMA: the basomedial nucleus, CeA: the central nucleus of the amygdala. Pir: the piriform cortex, CPu: the caudate putamen. Adapted from Paxinos and Franklin (2001). (c) Clomeleon was found in putative pyramidal cells in a sagittal section from another CLM1 brain. (d–h) Electrical stimulation to LA (red circle) elicited [Cl]i increase in BLA. [Cl]i change during stimulation shown in pseudo-color scale was overlaid on raw YFP fluorescence in gray scale. The image shown was acquired right after the stimulus. The experiment was done in P32 CLM1 mouse. (d) A response before application, (e) during bicuculline, (f) kynurenic acid, (g) bicuculline and kynurenic acid, and (h) recovery after application. (i) Time course of [Cl]i changes shown in the four conditions. The arrow (Stim) depicts the onset of electrical stimulation (30-μA pulses at 50 Hz for 2 s). Average of three trials in each condition. (j) Peak magnitude of [Cl]i changes in the five conditions shown in d–h. Mean ± SEM of three experiments. * denotes a significant difference from the rest or between the two conditions by ANOVA followed by Newman–Keuls test (*P < 0.05)
Fig. 10
Fig. 10
Clomeleon response in the superior colliculus (a) Clomeleon expression in the superior colliculus in a sagittal section from CLM1. (b) Time course of [Cl]i changes before (Control) and during application of GABAzine (SR). The arrow (Stim) depicts the onset of electrical stimulation (400-μA pulses at 20 Hz for 1 s). Average of three trials in each condition. (c) Peak magnitude of [Cl]i changes in the two conditions. Mean ± SEM of 20 experiments

References

    1. {'text': '', 'ref_index': 1, 'ids': [{'type': 'DOI', 'value': '10.1007/s10571-005-3059-6', 'is_inner': False, 'url': 'https://doi.org/10.1007/s10571-005-3059-6'}, {'type': 'PMC', 'value': 'PMC11529562', 'is_inner': False, 'url': 'https://pmc.ncbi.nlm.nih.gov/articles/PMC11529562/'}, {'type': 'PubMed', 'value': '16050036', 'is_inner': True, 'url': 'https://pubmed.ncbi.nlm.nih.gov/16050036/'}]}
    2. Baker, B.J., Kosmidis, E.K., Vucinic, D., Falk, C.X., Cohen, L.B., Djurisic, M., and Zecevic, D. (2005). Imaging brain activity with voltage- and calcium-sensitive dyes. Cell. Mol. Neurobiol. 25, 245–282. - PMC - PubMed
    1. {'text': '', 'ref_index': 1, 'ids': [{'type': 'PMC', 'value': 'PMC1189216', 'is_inner': False, 'url': 'https://pmc.ncbi.nlm.nih.gov/articles/PMC1189216/'}, {'type': 'PubMed', 'value': '2575165', 'is_inner': True, 'url': 'https://pubmed.ncbi.nlm.nih.gov/2575165/'}]}
    2. Ben-Ari, Y., Cherubini, E., Corradetti, R., and Gaiarsa, J.L. (1989). Giant synaptic potentials in immature rat CA3 hippocampal neurones. J. Physiol. (Lond). 416, 303–325. - PMC - PubMed
    1. None
    2. Berglund, K., Dunbar, R.L., Lee, P., Feng, G., and Augustine, G.J. (2005). A practical guide: imaging synaptic inhibition with Clomeleon, a genetically encoded chloride indicator. In imaging in neuroscience and development: a laboratory manual, A. Konnerth, and R. Yuste, eds. (Cold Spring Harbor: Cold Spring Harbor Laboratory Press), pp. 595–598.
    1. {'text': '', 'ref_index': 1, 'ids': [{'type': 'DOI', 'value': '10.1007/s11068-008-9019-6', 'is_inner': False, 'url': 'https://doi.org/10.1007/s11068-008-9019-6'}, {'type': 'PMC', 'value': 'PMC2673725', 'is_inner': False, 'url': 'https://pmc.ncbi.nlm.nih.gov/articles/PMC2673725/'}, {'type': 'PubMed', 'value': '18398684', 'is_inner': True, 'url': 'https://pubmed.ncbi.nlm.nih.gov/18398684/'}]}
    2. Berglund, K., Schleich, W., Krieger, P., Loo, L.S., Wang, D., Cant, N·B., Feng, G., Augustine, G.J., and Kuner, T. (2006). Imaging synaptic inhibition in transgenic mice expressing the chloride indicator, Clomeleon. Brain Cell Biol. 35, 207–228. - PMC - PubMed
    1. {'text': '', 'ref_index': 1, 'ids': [{'type': 'DOI', 'value': '10.1016/S0165-0270(96)00121-5', 'is_inner': False, 'url': 'https://doi.org/10.1016/s0165-0270(96)00121-5'}, {'type': 'PubMed', 'value': '9125370', 'is_inner': True, 'url': 'https://pubmed.ncbi.nlm.nih.gov/9125370/'}]}
    2. Caroni, P. (1997). Overexpression of growth-associated proteins in the neurons of adult transgenic mice. J. Neurosci. Methods 71, 3–9. - PubMed

Publication types

MeSH terms

LinkOut - more resources