. 2008 Oct 13;9(10):R150.
doi: 10.1186/gb-2008-9-10-r150.

Distinct transcriptional MYCN/c-MYC activities are associated with spontaneous regression or malignant progression in neuroblastomas

Affiliations

Distinct transcriptional MYCN/c-MYC activities are associated with spontaneous regression or malignant progression in neuroblastomas

Frank Westermann et al. Genome Biol. .

Abstract

Background: Amplified MYCN oncogene resulting in deregulated MYCN transcriptional activity is observed in 20% of neuroblastomas and identifies a highly aggressive subtype. In MYCN single-copy neuroblastomas, elevated MYCN mRNA and protein levels are paradoxically associated with a more favorable clinical phenotype, including disseminated tumors that subsequently regress spontaneously (stage 4s-non-amplified). In this study, we asked whether distinct transcriptional MYCN or c-MYC activities are associated with specific neuroblastoma phenotypes.

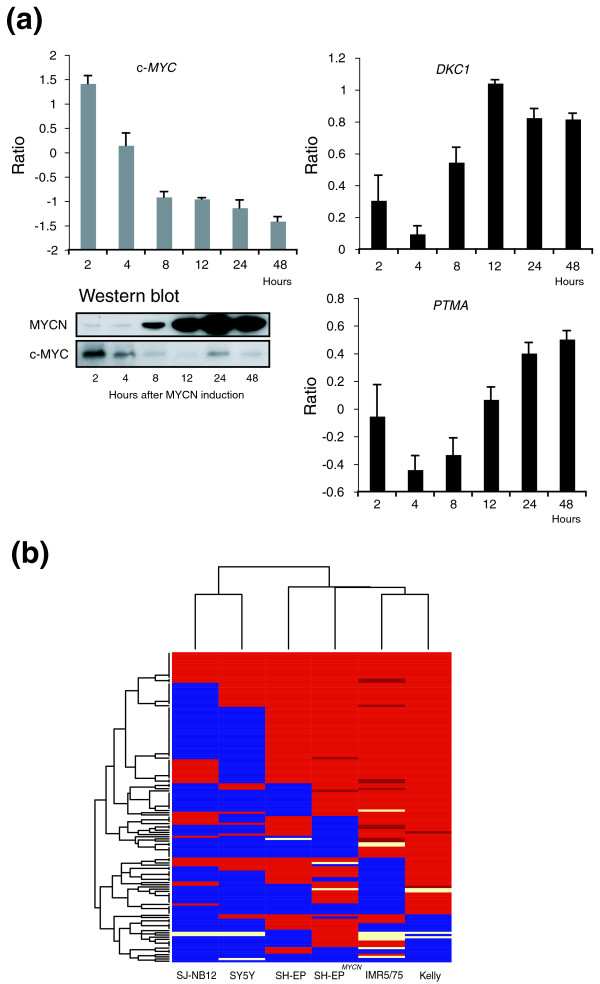
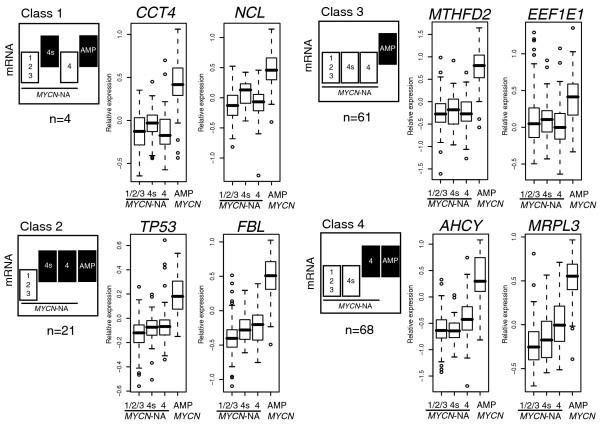
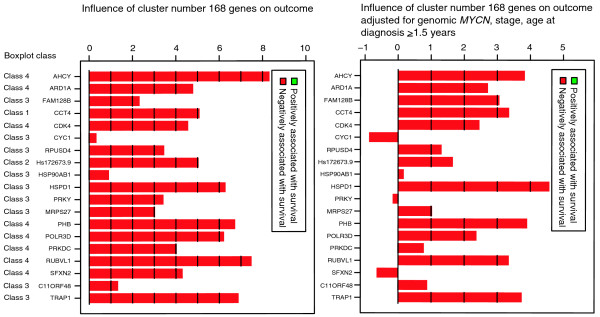
Results: We defined a core set of direct MYCN/c-MYC target genes by applying gene expression profiling and chromatin immunoprecipitation (ChIP, ChIP-chip) in neuroblastoma cells that allow conditional regulation of MYCN and c-MYC. Their transcript levels were analyzed in 251 primary neuroblastomas. Compared to localized-non-amplified neuroblastomas, MYCN/c-MYC target gene expression gradually increases from stage 4s-non-amplified through stage 4-non-amplified to MYCN amplified tumors. This was associated with MYCN activation in stage 4s-non-amplified and predominantly c-MYC activation in stage 4-non-amplified tumors. A defined set of MYCN/c-MYC target genes was induced in stage 4-non-amplified but not in stage 4s-non-amplified neuroblastomas. In line with this, high expression of a subset of MYCN/c-MYC target genes identifies a patient subtype with poor overall survival independent of the established risk markers amplified MYCN, disease stage, and age at diagnosis.

Conclusions: High MYCN/c-MYC target gene expression is a hallmark of malignant neuroblastoma progression, which is predominantly driven by c-MYC in stage 4-non-amplified tumors. In contrast, moderate MYCN function gain in stage 4s-non-amplified tumors induces only a restricted set of target genes that is still compatible with spontaneous regression.


Figures

Figure 1
Figure 1
Inverse correlation of MYCN and c-MYC mRNA levels in neuroblastoma subtypes. Relative mRNA expression is shown for MYCN and c-MYC as well as for MDM2, DKC1, and PTMA, three direct targets of MYCN/c-MYC. Data are represented as box plots: horizontal boundaries of boxes represent the 25th and 75th percentile. The 50th percentile (median) is denoted by a horizontal line in the box and whiskers above and below extend to the most extreme data point, which is no more than 1.5 times the interquartile range from the box. A set of 251 primary neuroblastoma tumors was analyzed consisting of 138 localized-NA (stage 1/2/3), 30 stage 4s-NA, 52 stage 4-NA and 31 MYCN amplified (AMP) neuroblastoma tumors. Gene expression levels from stage 4s-NA, stage 4-NA, and MYCN amplified tumors were compared pair-wise with those of localized-NA tumors as reference. Differential gene expression was assessed for each gene by using the Mann-Whitney test (cut-off of p < 0.05).
Figure 2
Figure 2
Identification and validation of MYCN/c-MYC target genes in neuroblastoma cell lines. (a) Repression of endogenous c-MYC by targeted expression of a MYCN transgene in SH-EPMYCN cells defines MYCN/c-MYC-regulated genes. MYCN and c-MYC protein levels were monitored in a time series after removing tetracycline in exponentially growing SH-EPMYCN cells that stably express a tetracycline-regulated MYCN transgene. Mean and standard deviation of the relative mRNA levels of MYC, DKC1 and PTMA are given from two time series experiments as measured by a customized neuroblastoma oligo microarray. (b) Hierarchical clustering of MYCN- and c-MYC binding to 140 target gene promoters as measured by ChIP-chip in 6 neuroblastoma cell lines. ChIP-chip results of 140 MYCN/c-MYC target genes from 5 neuroblastoma cell lines that preferentially express either high levels of MYCN (SH-EPMYCN, IMR5/75 (approximately 75 copies of MYCN) and Kelly (approximately 100-120 copies of MYCN)) or c-MYC (SJ-NB12 and SY5Y). Additionally, as an intermediate type, parental SH-EP cells were analyzed. SH-EP cells preferentially express c-MYC, but also low levels of MYCN. ChIP-chip experiments were performed with a monoclonal antibody against human MYCN and a polyclonal antibody against human c-MYC for each neuroblastoma cell line. A cut-off for positive binding was set for both transcription factors to >4-fold enrichment for one and >2-fold enrichment of at least one of the two neighboring probes. MYCN/c-MYC-binding is color-coded as follows: blue, c-MYC binding; red, MYCN/c-MYC binding; dark red, MYCN binding; light yellow, lack of MYCN/c-MYC binding. Hierarchical clustering was used to group neuroblastoma cell lines according to their MYCN/c-MYC-binding pattern. Differentiation between MYCN and c-MYC-binding was mainly achieved through the monoclonal MYCN antibody. The polyclonal antibody against c-MYC also gave positive binding signals for a large set of analyzed target gene promoters in neuroblastoma cell lines with high MYCN that lack c-MYC expression (SH-EPMYCN, IMR5/75 and Kelly).
Figure 3
Figure 3
Expression of MYCN/c-MYC target genes in neuroblastoma subtypes. Differential expression was analyzed for each of the genes (n = 154) in MYCN amplified (AMP), stage 4s-NA and stage 4-NA tumors using localized-NA (stage 1/2/3) tumors as reference in pair-wise comparisons (Mann-Whitney test, cut-off p < 0.05, black). We grouped each of these 154 genes into one of four classes based on their relative expression in clinically relevant neuroblastoma subtypes. These classes were, compared to localized-NA tumors: overexpressed in MYCN amplified and in stage 4s-NA tumors (class 1; CCT4 and NCL); overexpressed in MYCN amplified, stage 4-NA and stage 4s-NA tumors (class 2; TP53 and FBL); overexpressed in MYCN amplified tumors (class 3; MTHFD2 and EEF1E1); and overexpressed in MYCN amplified and stage 4-NA tumors (class 4; AHCY and MRPL3).
Figure 4
Figure 4
Association of cluster 168 genes with overall survival. The two gene plots illustrate the influence on overall survival of each gene from cluster 168. The gene plot gives the influence on overall survival without (left) and with (right) adjustment for the variables genomic MYCN status, age at diagnosis (≥1.5 years), and disease stage (stages 1, 2, 3, 4s versus stage 4). The gene plot shows a bar and a reference line for each gene tested. In a survival model, the expected height is zero under the null hypothesis that the gene is not associated with the clinical outcome (= reference line). Marks in the bars indicate by how many standard deviations the bar exceeds the reference line. The bars are colored to indicate a negative (red) association of a gene's expression with overall survival. In addition, the boxplot class is given for each gene.
Figure 5
Figure 5
Representation of MYCN/c-MYC target genes in a gene expression-based neuroblastoma risk stratification system. Two-way hierarchical cluster analysis using 144 oligonucleotide probes from the gene expression-based classifier and the 251 patients from the entire cohort. Clinical characteristics (outcome, white = no event, gray = relapse/progression, black = death due to neuroblastoma; genomic MYCN status, white = NA, black = amplified; chromosome 1p status, white = normal, black = 1p deleted, gray = not available; chromosome 11q status, white = normal, black = 11q deleted, gray = not available; age at diagnosis, white <1.5 years, black ≥1.5 years; disease stage, white = stage 1, 2, gray = stage 3, yellow = stage 4s, black = stage 4) are added to the heatmap of gene expression. The gene expression cluster with direct MYCN/c-MYC target genes is highlighted. The Rank Classifier column gives the classifier rank found by the Prediction Analysis for Microarrays algorithm and a complete 10-times-repeated 10-fold cross validation. The Cluster column gives the results from the SOM analysis using gene expression profiles from SH-EPMYCN cells. The MYCN/c-MYC regulated column gives the fold changes after MYCN induction. The Ebox column gives the position of a canonical E-box in the promoter. The c-MYC TGDB column gives the entries in the public c-MYC target gene database. *UP, upregulated.

References

    1. Schwab M, Westermann F, Hero B, Berthold F. Neuroblastoma: biology and molecular and chromosomal pathology. Lancet Oncol. 2003;4:472–480. - PubMed
    1. Vandesompele J, Baudis M, De Preter K, Van Roy N, Ambros P, Bown N, Brinkschmidt C, Christiansen H, Combaret V, Lastowska M, Nicholson J, O'Meara A, Plantaz D, Stallings R, Brichard B, Broecke C Van den, De Bie S, De Paepe A, Laureys G, Speleman F. Unequivocal delineation of clinicogenetic subgroups and development of a new model for improved outcome prediction in neuroblastoma. J Clin Oncol. 2005;23:2280–2299. - PubMed
    1. Seeger RC, Brodeur GM, Sather H, Dalton A, Siegel SE, Wong KY, Hammond D. Association of multiple copies of the N-myc oncogene with rapid progression of neuroblastomas. N Engl J Med. 1985;313:1111–1116. - PubMed
    1. Weiss WA, Aldape K, Mohapatra G, Feuerstein BG, Bishop JM. Targeted expression of MYCN causes neuroblastoma in transgenic mice. EMBO J. 1997;16:2985–2995. - PMC - PubMed
    1. Schwab M, Varmus HE, Bishop JM. Human N-myc gene contributes to neoplastic transformation of mammalian cells in culture. Nature. 1985;316:160–162. - PubMed

Publication types

MeSH terms