

Bimodal protein targeting through activation of cryptic mitochondrial targeting signals by an inducible cytosolic endoprotease
- PMID: 18851831
- PMCID: PMC2743273
- DOI: 10.1016/j.molcel.2008.09.008
Bimodal protein targeting through activation of cryptic mitochondrial targeting signals by an inducible cytosolic endoprotease
Abstract
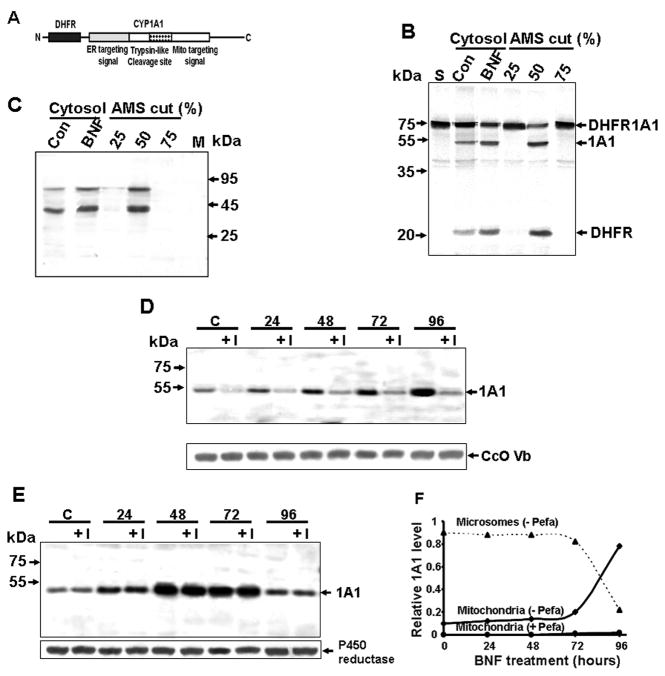
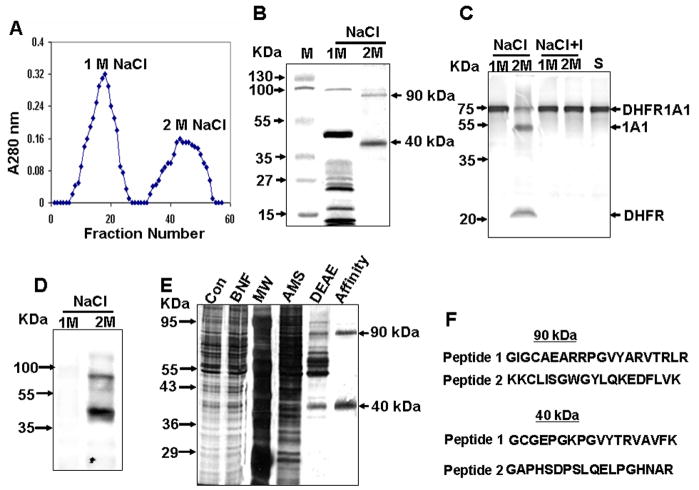
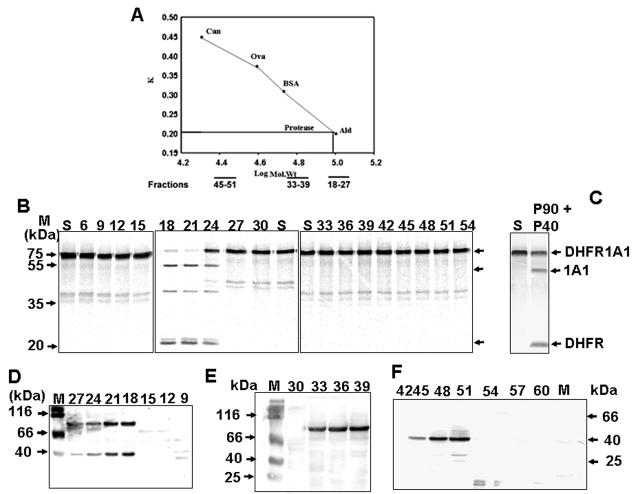
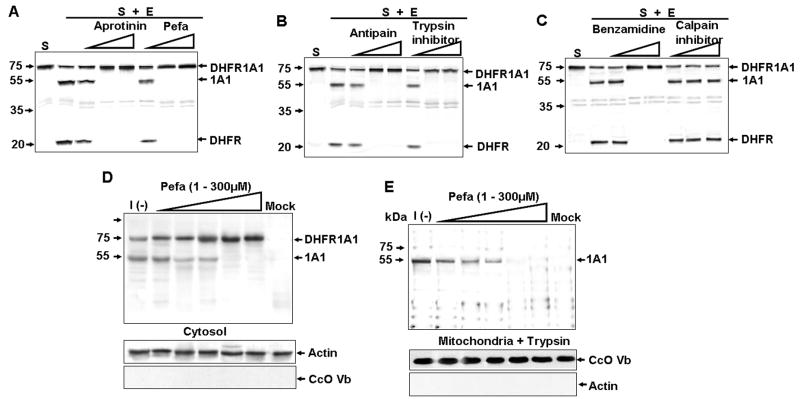
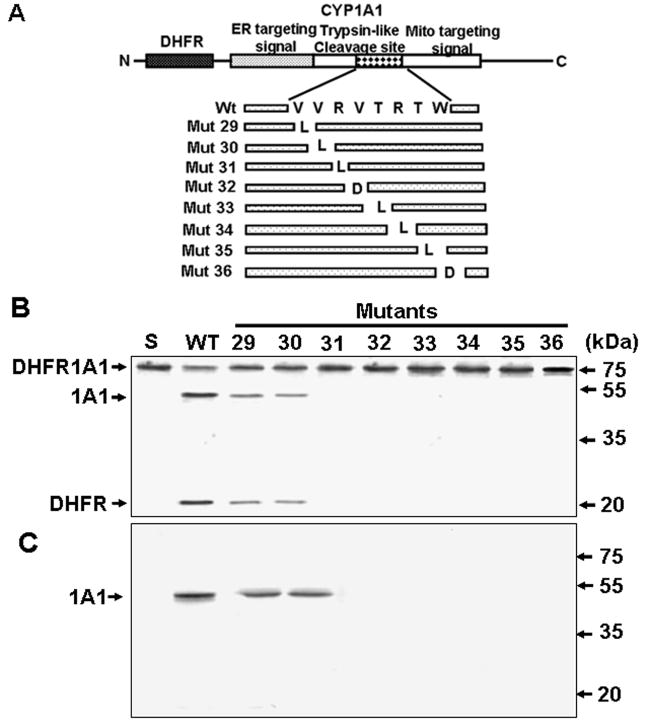
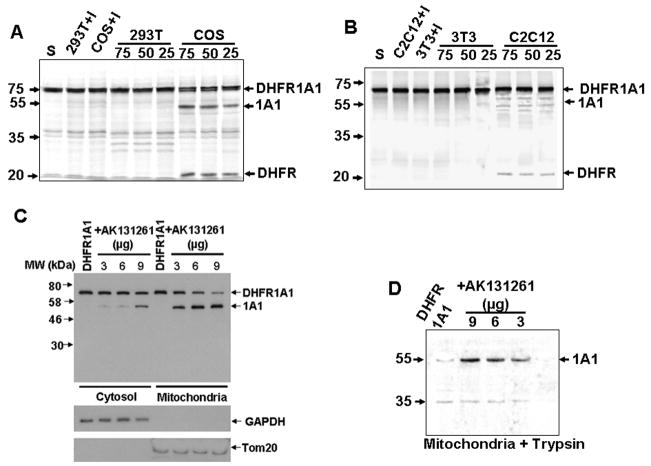
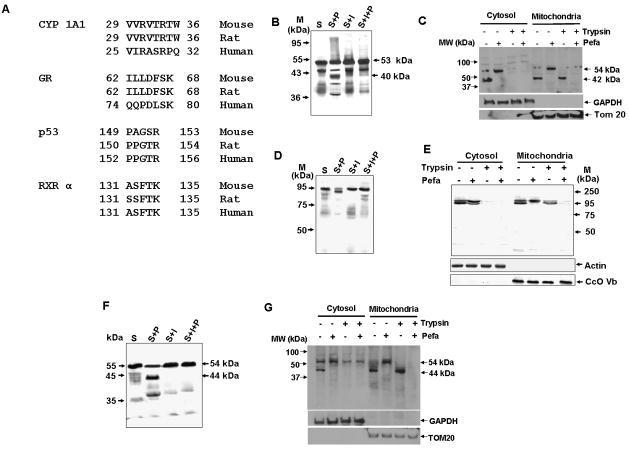
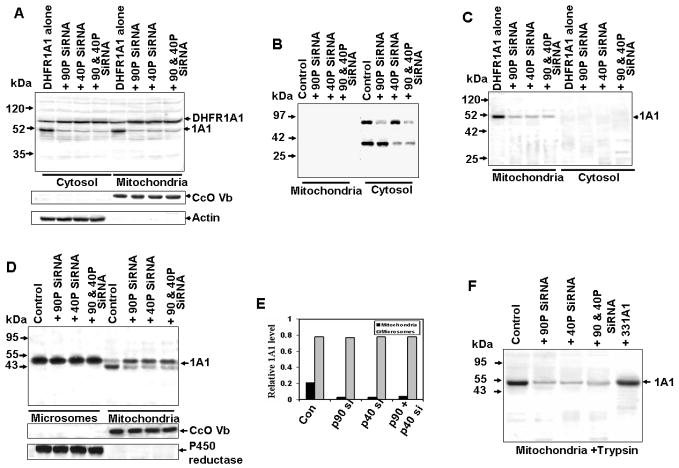
Bimodal targeting of the endoplasmic reticular protein, cytochrome P4501A1 (CYP1A1), to mitochondria involves activation of a cryptic mitochondrial targeting signal through endoprotease processing of the protein. Here, we characterized the endoprotease that regulates mitochondrial targeting of CYP1A1. The endoprotease, which was induced by beta-naphthoflavone, was a dimer of 90 kDa and 40 kDa subunits, each containing Ser protease domains. The purified protease processed CYP1A1 in a sequence-specific manner, leading to its mitochondrial import. The glucocorticoid receptor, retinoid X receptor, and p53 underwent similar processing-coupled mitochondrial transport. The inducible 90 kDa subunit was a limiting factor in many cells and some tissues and, thus, regulates the mitochondrial levels of these proteins. A number of other mitochondria-associated proteins with noncanonical targeting signals may also be substrates of this endoprotease. Our results describe a new mechanism of mitochondrial protein import that requires an inducible cytoplasmic endoprotease for activation of cryptic mitochondrial targeting signals.
Figures
Similar articles
-
Bimodal targeting of cytochrome P450s to endoplasmic reticulum and mitochondria: the concept of chimeric signals.FEBS J. 2011 Nov;278(22):4218-29. doi: 10.1111/j.1742-4658.2011.08356.x. Epub 2011 Oct 24. FEBS J. 2011. PMID: 21929726 Free PMC article. Review.
-
Targeting of NH2-terminal-processed microsomal protein to mitochondria: a novel pathway for the biogenesis of hepatic mitochondrial P450MT2.J Cell Biol. 1997 Nov 3;139(3):589-99. doi: 10.1083/jcb.139.3.589. J Cell Biol. 1997. PMID: 9348277 Free PMC article.
-
Accumulation of mitochondrial P450MT2, NH(2)-terminal truncated cytochrome P4501A1 in rat brain during chronic treatment with beta-naphthoflavone. A role in the metabolism of neuroactive drugs.J Biol Chem. 2000 Nov 3;275(44):34415-23. doi: 10.1074/jbc.M004431200. J Biol Chem. 2000. PMID: 10915793 Free PMC article.
-
Physiological role of the N-terminal processed P4501A1 targeted to mitochondria in erythromycin metabolism and reversal of erythromycin-mediated inhibition of mitochondrial protein synthesis.J Biol Chem. 1999 Mar 5;274(10):6617-25. doi: 10.1074/jbc.274.10.6617. J Biol Chem. 1999. PMID: 10037757
-
The mitochondrial processing peptidase: function and specificity.Experientia. 1996 Dec 15;52(12):1077-82. doi: 10.1007/BF01952105. Experientia. 1996. PMID: 8988249 Review.
Cited by
-
Human liver mitochondrial cytochrome P450 2D6--individual variations and implications in drug metabolism.FEBS J. 2009 Jul;276(13):3440-53. doi: 10.1111/j.1742-4658.2009.07067.x. Epub 2009 May 11. FEBS J. 2009. PMID: 19438707 Free PMC article.
-
Bimodal targeting of cytochrome P450s to endoplasmic reticulum and mitochondria: the concept of chimeric signals.FEBS J. 2011 Nov;278(22):4218-29. doi: 10.1111/j.1742-4658.2011.08356.x. Epub 2011 Oct 24. FEBS J. 2011. PMID: 21929726 Free PMC article. Review.
-
TP53 mutation, mitochondria and cancer.Curr Opin Genet Dev. 2016 Jun;38:16-22. doi: 10.1016/j.gde.2016.02.007. Epub 2016 Mar 19. Curr Opin Genet Dev. 2016. PMID: 27003724 Free PMC article. Review.
-
Mitochondrial trafficking of APP and alpha synuclein: Relevance to mitochondrial dysfunction in Alzheimer's and Parkinson's diseases.Biochim Biophys Acta. 2010 Jan;1802(1):11-9. doi: 10.1016/j.bbadis.2009.07.007. Epub 2009 Jul 18. Biochim Biophys Acta. 2010. PMID: 19619643 Free PMC article. Review.
-
Mitochondrial accumulation of APP and Abeta: significance for Alzheimer disease pathogenesis.J Cell Mol Med. 2009 Oct;13(10):4137-45. doi: 10.1111/j.1582-4934.2009.00892.x. Epub 2009 Sep 1. J Cell Mol Med. 2009. PMID: 19725915 Free PMC article. Review.
References
-
- Anandatheerthavarada HK, Vijayasarathy C, Bhagwat SV, Biswas G, Mullick J, Avadhani NG. Physiological role of the N-terminal processed P4501A1 targeted to mitochondria in erythromycin metabolism and reversal of erythromycin-mediated inhibition of mitochondrial protein synthesis. J Biol Chem. 1999;274:6617–6625. - PubMed
-
- Batra R, Khayat R, Tong L. Molecular mechanism for dimerization to regulate the catalytic activity of human cytomegalovirus protease. Nature Structural Biology. 2001;8:810–817. - PubMed
-
- Bell JK, Goetz DH, Mahrus S, Harris JL, Fletterick RJ, Craik CS. The oligomeric structure of human granzyme A is a determinant of its extended substrate specificity. 2003;10:527–534. - PubMed
-
- Bhagwat SV, Biswas G, Anandatheerthavarada HK, Addya S, Pandak W, Avadhani NG. Dual Targeting Property of the N-terminal Signal Sequence of P4501A1. Targeting of heterologous proteins to endoplasmic reticulum and mitochondria. J Biol Chem. 1999;274:24014–24022. - PubMed
Publication types
MeSH terms
Substances
Grants and funding
LinkOut - more resources
Full Text Sources
Research Materials
Miscellaneous
