

Bayesian analysis of amino acid substitution models
- PMID: 18852098
- PMCID: PMC2607418
- DOI: 10.1098/rstb.2008.0175
Bayesian analysis of amino acid substitution models
Abstract
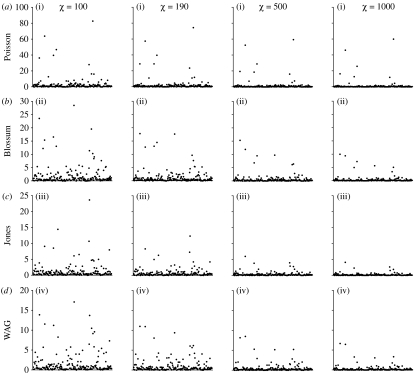
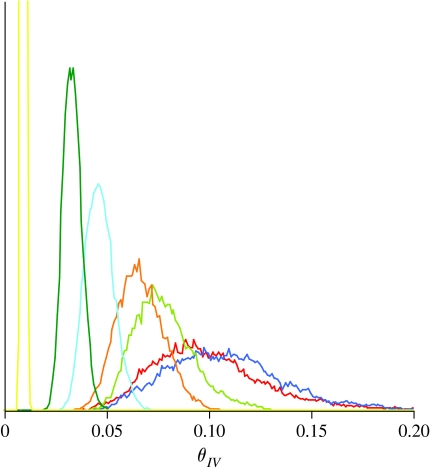
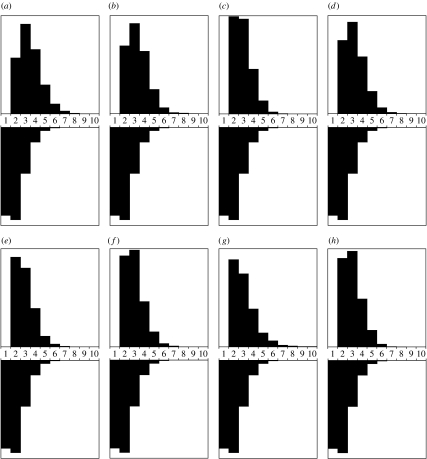
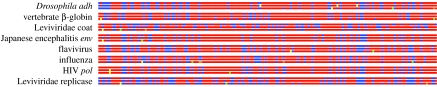
Models of amino acid substitution present challenges beyond those often faced with the analysis of DNA sequences. The alignments of amino acid sequences are often small, whereas the number of parameters to be estimated is potentially large when compared with the number of free parameters for nucleotide substitution models. Most approaches to the analysis of amino acid alignments have focused on the use of fixed amino acid models in which all of the potentially free parameters are fixed to values estimated from a large number of sequences. Often, these fixed amino acid models are specific to a gene or taxonomic group (e.g. the Mtmam model, which has parameters that are specific to mammalian mitochondrial gene sequences). Although the fixed amino acid models succeed in reducing the number of free parameters to be estimated--indeed, they reduce the number of free parameters from approximately 200 to 0--it is possible that none of the currently available fixed amino acid models is appropriate for a specific alignment. Here, we present four approaches to the analysis of amino acid sequences. First, we explore the use of a general time reversible model of amino acid substitution using a Dirichlet prior probability distribution on the 190 exchangeability parameters. Second, we then explore the behaviour of prior probability distributions that are'centred' on the rates specified by the fixed amino acid model. Third, we consider a mixture of fixed amino acid models. Finally, we consider constraints on the exchangeability parameters as partitions,similar to how nucleotide substitution models are specified, and place a Dirichlet process prior model on all the possible partitioning schemes.
Figures
References
-
- Adachi J, Hasegawa M. MOLPHY v. 2.3: programs for molecular phylogenetics based on maximum likelihood. Comput. Sci. Monogr. 1996;28:1–150.
-
- Adachi J, Waddell P, Martin W, Hasegawa M. Plastid genome phylogeny and a model of amino acid substitution for proteins encoded by chloroplast DNA. J. Mol. Evol. 2000;50:348–358. - PubMed
-
- Antoniak C.E. Mixtures of Dirichlet processes with applications to non-parametric problems. Ann. Stat. 1974;2:1152–1174. doi:10.1214/aos/1176342871 - DOI
-
- Bell E.T. Exponential numbers. Am. Math. Monthly. 1934;41:411–419. doi:10.2307/2300300 - DOI
-
- Bishop M.J, Friday A.E. Tetrapod relationships: the molecular evidence. In: Patterson C, editor. Molecules and morphology in evolution: conflict or compromise? Cambridge University Press; Cambridge, UK: 1987. pp. 123–140.
Publication types
MeSH terms
Grants and funding
LinkOut - more resources
Full Text Sources
Other Literature Sources