

A model of evolution and structure for multiple sequence alignment
- PMID: 18852103
- PMCID: PMC2592536
- DOI: 10.1098/rstb.2008.0170
A model of evolution and structure for multiple sequence alignment
Abstract
We have developed a phylogeny-aware progressive alignment method that recognizes insertions and deletions as distinct evolutionary events and thus avoids systematic errors created by traditional alignment methods. We now extend this method to simultaneously model regional heterogeneity and evolution. This novel method can be flexibly adapted to alignment of nucleotide or amino acid sequences evolving under processes that vary over genomic regions and, being fully probabilistic, provides an estimate of regional heterogeneity of the evolutionary process along the alignment and a measure of local reliability of the solution. Furthermore, the evolutionary modelling of substitution process permits adjusting the sensitivity and specificity of the alignment and, if high specificity is aimed at, leaving sequences unaligned when their divergence is beyond a meaningful detection of homology.
Figures
 ,
,  and
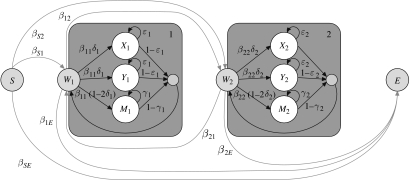
and  ), each alignment describing the ancestral node for the two nodes (extant or ancestral sequences) to be aligned. (b) The substitution process in each structure class is described by an instantaneous rate matrix Qi, here indicated by plots
  and
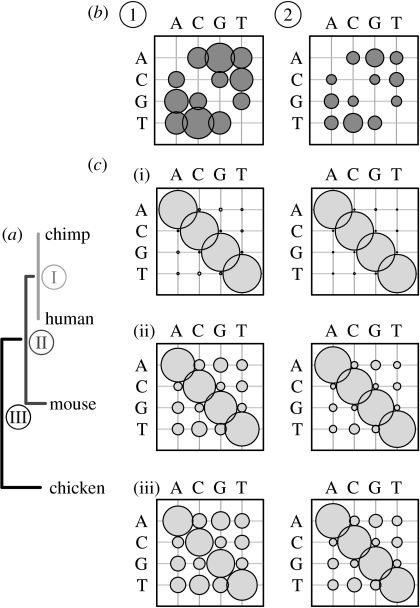
and  showing the rates between different nucleotides as relative sizes of bubbles. In this example, structure classes 1 and 2 model regions of DNA sequence that evolve at the rate that is 150 and 50 per cent of the average rate, respectively. (c) For each pairwise alignment, indicated by different shades in the tree (a), substitution probability matrices for every structure class are computed from the corresponding matrix Qi. The evolutionary divergence between the sequence/ancestral node pairs to be aligned varies, as shown by the relative length of horizontal bars in the tree, and the alignments contain unequal amounts of information to distinguish the two evolutionary processes. (i) Between human and chimpanzee, both fast and slowly evolving regions (left and right matrix, respectively) are mostly conserved and the diagonal bubbles indicating no change are dominant. In the alignment of (ii) primate ancestor to mouse and (iii) mammalian ancestor to chicken, the fast evolving regions (left matrix) contain greater numbers of substitutions and the off-diagonal bubbles are relatively bigger.
References
-
- Arribas-Gil, A., Metzler, D. & Plouhinec, J.-L. 2007 Statistical alignment with a sequence evolution model allowing rate heterogeneity along the sequence, IEEE/ACM Trans. Comput. Biol. Bioinform 29 Aug 2007, IEEE Computer Society Digital Library. (doi:10.1109/TCBB.2007.70246) - DOI - PubMed
-
- Durbin R, Eddy S, Krogh A, Mitchison G. Cambridge University Press; Cambridge, UK: 1998. Biological sequence analysis: probabilistic models of proteins and nucleic acids.
-
- Eddy S. Profile hidden Markov models. Bioinformatics. 1998;14:755–763. doi:10.1093/bioinformatics/14.9.755 - DOI - PubMed
-
- Edgar R, Sjölander K. SATCHMO: sequence alignment and tree construction using hidden Markov models. Bioinformatics. 2003;19:1404–1411. doi:10.1093/bioinformatics/btg158 - DOI - PubMed
-
- Gotoh O. An improved algorithm for matching biological sequences. J. Mol. Biol. 1982;162:705–708. doi:10.1016/0022-2836(82)90398-9 - DOI - PubMed
MeSH terms
LinkOut - more resources
Full Text Sources