Review
. 2008 Oct 15;17(R2):R143-50.
doi: 10.1093/hmg/ddn268.

Accounting for ancestry: population substructure and genome-wide association studies

Affiliations
Review

Accounting for ancestry: population substructure and genome-wide association studies

Chao Tian et al. Hum Mol Genet. .

Abstract

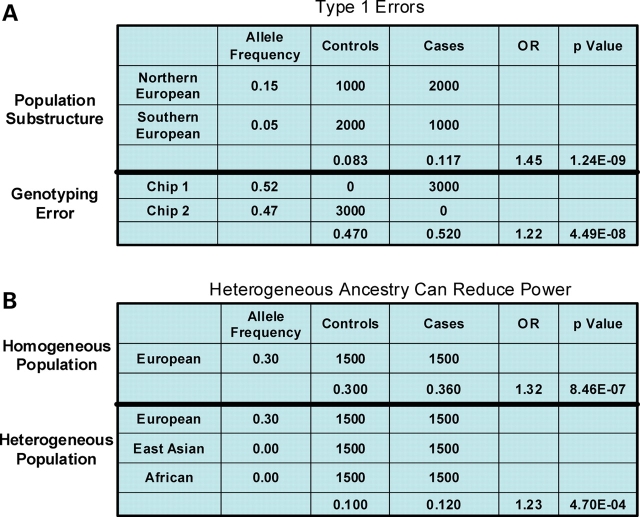
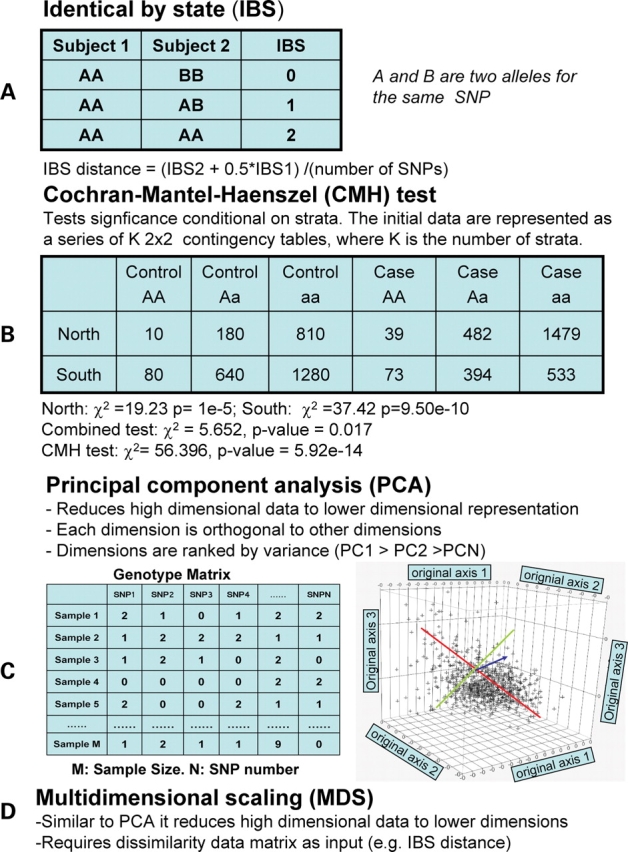
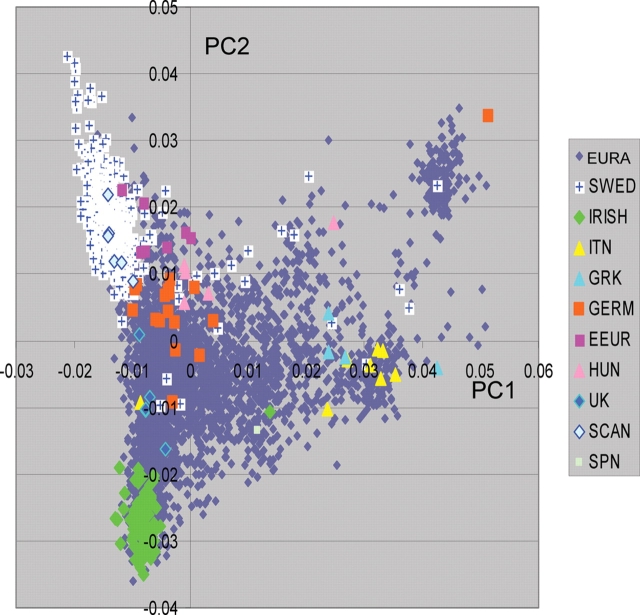
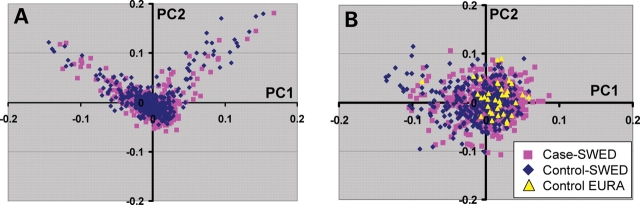
Accounting for the genetic substructure of human populations has become a major practical issue for studying complex genetic disorders. Allele frequency differences among ethnic groups and subgroups and admixture between different ethnic groups can result in frequent false-positive results or reduced power in genetic studies. Here, we review the problems and progress in defining population differences and the application of statistical methods to improve association studies. It is now possible to take into account the confounding effects of population stratification using thousands of unselected genome-wide single-nucleotide polymorphisms or, alternatively, selected panels of ancestry informative markers. These methods do not require any demographic information and therefore can be widely applied to genotypes available from multiple sources. We further suggest that it will be important to explore results in homogeneous population subsets as we seek to define the extent to which genomic variation influences complex phenotypes.


Figures

Figure 1.
Figure 1.
Examples of how stratification and ancestry can affect case–control association tests. In the top panel, examples of type 1 errors are shown. Population substructure can result in false-positive associations when the regional origin/ancestry of cases and controls are not matched. In the example shown, a 10% allele frequency difference in northern European compared with southern European results in a highly significant P-value (Armitage’s χ2 test) when the numbers of cases and controls derived from these regions are different. The top panel also shows an example of genotyping error that can result from genotyping cases and controls using different array chips. The bottom panel illustrates how type 2 errors, false-negative results may result from heterogeneous sample sets. In this example, a true positive result may not reach an appropriate threshold for significance when the signal is diluted by a population in which the causative SNP is absent.
Figure 2.
Figure 2.
Definition of statistical terms and tests. (A) Schematic of how identical by state distance is measured. (B) An example of the application of the Cochran–Mantel–Haenszel (CMH) test. In this example, two strata (North and South) are defined. These strata (K) can be determined using some methodology (e.g. clustering algorithm). The method assumes that each stratum has the same odds ratio. In this example the A allele has an odds ratio of 1.5. The substantial gain in power is illustrated by comparing CMH test result with the combined data. (C) The features of PCA; the high dimensional data shown in the genotype matrix (M × N) is reduced to orthogonal dimensions with the largest variance in PC1 represented by the red line. (D) The features of MDS are shown.
Figure 3.
Figure 3.
European Population Substructure. The first two principal components are shown for a diverse group of >3000 European and European American subjects. The clustering of different groups within Europe is shown for each individual designated by a symbol. The subjects from specific countries of origin or with four grandparental defined European countries of origin are color coded as shown in the legend with grey symbols indicated European Americans (EURA) with insufficient country of origin information. The groups from the following countries or regions are included: Sweden (SWED), Ireland (IRISH), Italy (ITN), Greece (GRK), Germany (GERM), Eastern Europe (EEUR), Hungary (HUN), United Kingdom (UK), Scandinavia (SCAN), and Spain (SPN). Although not included in this figure, additional studies indicate that the cluster in the right upper quadrant corresponds to an Ashkenazi Jewish grouping.
Figure 4.
Figure 4.
Illustration of the use of PCA to select homogeneous sample sets. In this example, cases derived from a Swedish population and the controls were from both Sweden and European Americans. (A) The first and second principal component (PC1 and PC2) for the Swedish cases and control subjects. (B) Homogeneous subject set selected from Swedish cases and controls and 3447 European American subjects (same set as shown in Fig. 1). Color code indicates the origin of the subjects. The basic procedure was to remove Multivariate outliers based on Mahalanobis distance. The minimum covariance determinant (MCD) estimators of location and scatter of PCA scores of the entire dataset were calculated using R. The Mahalanobis distances were then calculated using the robust estimators, leading to robust distance (RD). For multivariate normally distributed data the RD values are approximately χ2 distributed with p degree-of-freedom (p is the number of dimensions). The procedure was applied in two steps. For the first phase of selection we removed case outliers using robust distance measurements. The significance level was set at α = 0.001 to remove the case outliers. A second phase repeating the same process was applied to the case–control dataset. This was based on the case-only robust estimators of location and scatter in order to define a more homogeneous case–control sample set. The significance level was set at α = 0.05 for this phase of the procedure.

References

    1. Genome-wide association study of 14,000 cases of seven common diseases and 3,000 shared controls. Nature. 2007;447:661–678. - PMC - PubMed
    1. Plenge R.M., Seielstad M., Padyukov L., Lee A.T., Remmers E.F., Ding B., Liew A., Khalili H., Chandrasekaran A., Davies L.R., et al. TRAF1-C5 as a risk locus for rheumatoid arthritis—a genomewide study. N. Engl. J. Med. 2007;357:1199–1209. - PMC - PubMed
    1. Hom G., Graham R.R., Modrek B., Taylor K.E., Ortmann W., Garnier S., Lee A.T., Chung S.A., Ferreira R.C., Pant P.V., et al. Association of systemic lupus erythematosus with C8orf13-BLK and ITGAM-ITGAX. N. Engl. J. Med. 2008;358:900–909. - PubMed
    1. Laird N.M., Lange C. Family-based designs in the age of large-scale gene-association studies. Nat. Rev. Genet. 2006;7:385–394. - PubMed
    1. Chen W.M., Abecasis G.R. Family-based association tests for genomewide association scans. Am. J. Hum. Genet. 2007;81:913–926. - PMC - PubMed

Publication types

Substances