. 2009 Jan;77(1):32-44.
doi: 10.1128/IAI.00772-08. Epub 2008 Oct 13.

Mode of expression and functional characterization of FCT-3 pilus region-encoded proteins in Streptococcus pyogenes serotype M49

Affiliations

Mode of expression and functional characterization of FCT-3 pilus region-encoded proteins in Streptococcus pyogenes serotype M49

Masanobu Nakata et al. Infect Immun. 2009 Jan.

Abstract

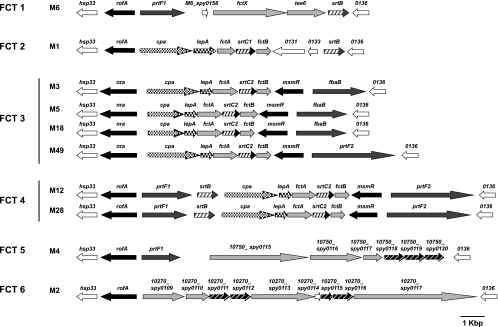
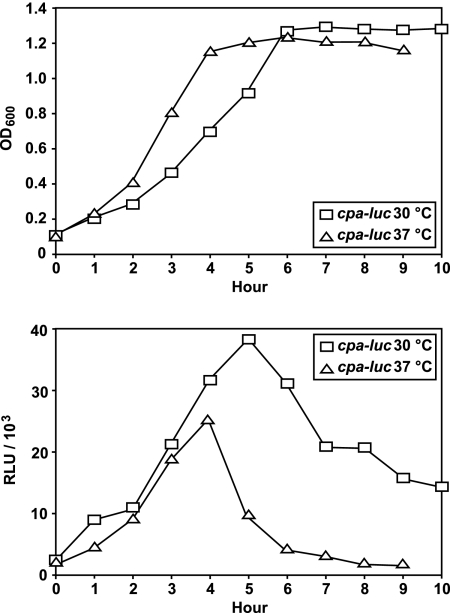
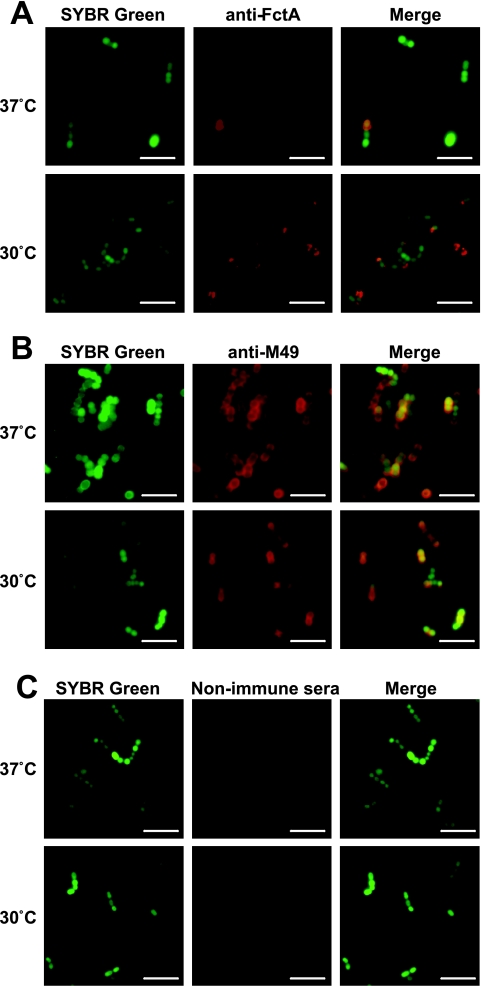
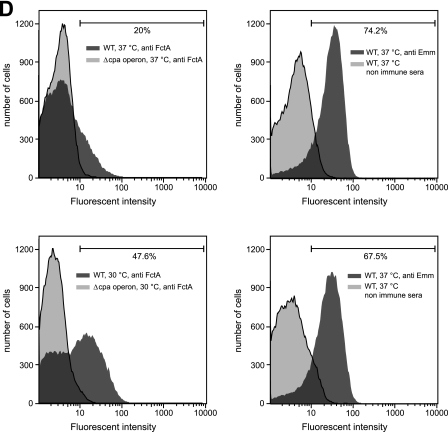
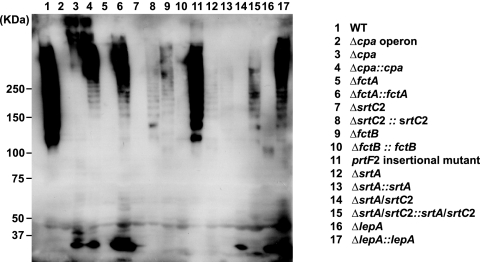
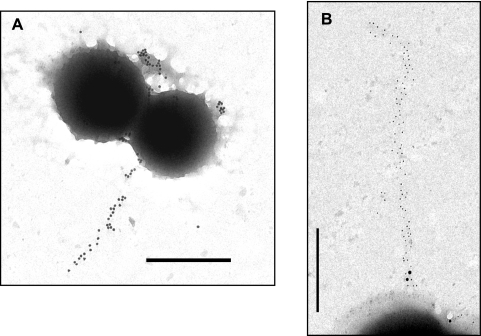
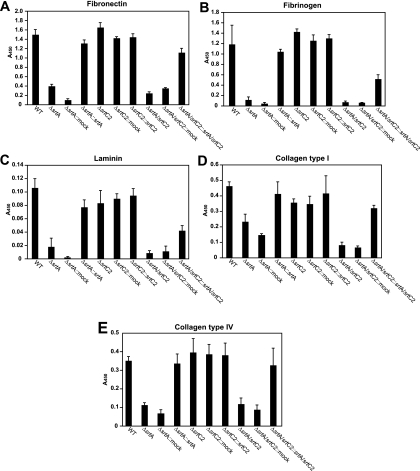
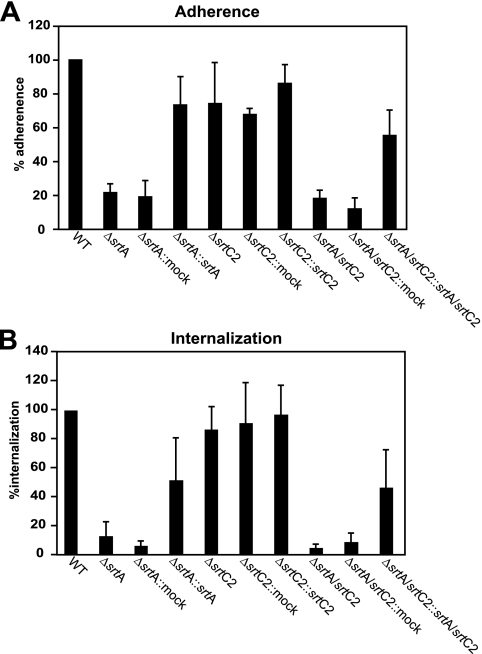
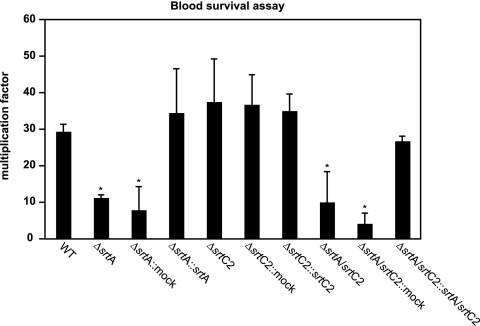
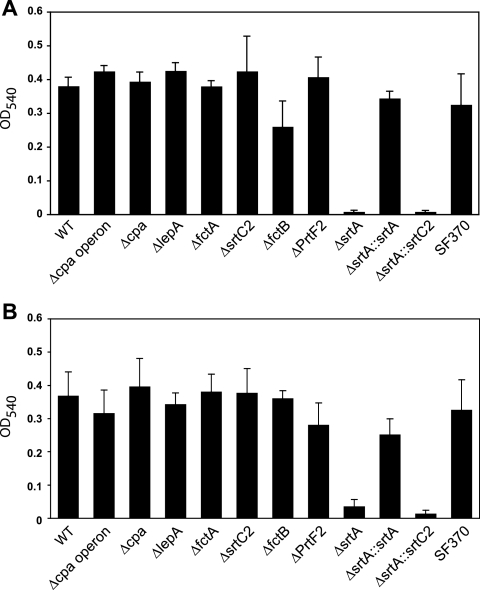
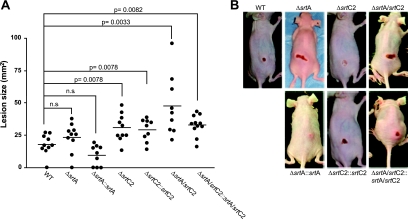
The human pathogen Streptococcus pyogenes (group A streptococcus [GAS]) pilus components, suggested to play a role in pathogenesis, are encoded in the variable FCT (fibronectin- and collagen-binding T-antigen) region. We investigated the functions of sortase A (SrtA), sortase C2 (SrtC2), and the FctA protein of the most prevalent type 3 FCT region from a serotype M49 strain. Although it is considered a housekeeping sortase, SrtA's activity is involved in pilus formation in addition to its essentiality for GAS extracellular matrix protein binding, host cell adherence/internalization, survival in human blood, and biofilm formation. SrtC2 activity is crucial for pilus formation but dispensable for the other phenotypes tested in vitro. FctA is the major pilus backbone protein, simultaneously acting as the M49 T antigen, and requires SrtC2 and LepA, a signal peptidase I homologue, for monomeric surface expression and polymerization, respectively. Collagen-binding protein Cpa expression supports pilus formation at the pilus base. Immunofluorescence microscopy and fluorescence-activated cell sorting analysis revealed several unexpected expression patterns, as follows: (i) the monomeric pilus protein FctA was found exclusively at the old poles of GAS cells, (ii) FctA protein expression increased with lower temperatures, and (iii) FctA protein expression was restricted to 20 to 50% of a given GAS M49 population, suggesting regulation by a bistability mode. Notably, disruption of pilus assembly by sortase deletion rendered GAS serotype M49 significantly more aggressive in a dermonecrotic mouse infection model, indicating that sortase activity and, consequently, pilus expression allow a subpopulation of this GAS serotype to be less aggressive. Thus, pilus expression may not be a virulence attribute of GAS per se.


Figures

FIG. 1.
FIG. 1.
Gene organization of FCT regions. Genetic heterogeneity of FCT regions from 10 different M serotypes is shown according to publically available sequences. Black arrows, transcriptional regulator genes, including rofA, nra, and msmR; dark gray arrows, fibronectin-binding protein genes, including prtF1, prtF2, and fbaB; light gray arrows, previously reported or inferred surface-expressed protein genes with unknown functions, including fctA and fctB; pavement-like arrows, collagen-binding protein gene; dark and light gray hatched arrows, sortase genes, including srtC1, srtC2, srtB, and putative genes encoding sortase; white-dotted black arrows, lepA; and white arrows, other open reading frames. The spy gene numbers were assigned according to the corresponding genes in the M1 genome sequence. Gene designations are presented above each arrow. *, an internal stop codon is present (codon 218 in nra [M18] and codon 102 in srtB [M12]). The FCT types are shown according to the work of Kratovac et al. (26). The GenBank accession numbers and strains for each serotype are as follows: M1, NC_002737 and SF370; M2, NC_008022 and MGAS10270; M3, NC_004606 and SSI-1; M4, NC_008024 and MGAS10750; M5, NC_009332 and Manfredo; M6, NC_006086 and MGAS10394; M12, AF447492 and A735; M18, NC_003485 and MGAS8232; and M28, NC_007296 and MGAS6180. The genetic map from a serotype M49 strain is shown based on the genome sequence of strain 591 (7) (GenBank accession no. NZ_AAFV01000006).
FIG. 2.
FIG. 2.
Comparison of temporal luciferase activities from cpa-luc grown at different incubation temperatures. The strains were grown in THY medium under a CO2-enriched atmosphere. Luciferase activities and culture densities were measured at 30°C and 37°C at hourly intervals. Data for one representative experiment of three independent experiments are shown. OD600, optical density at 600 nm; RLU, relative light units.
FIG. 3.
FIG. 3.
Localization and expression of FctA and M protein on the GAS surface at different temperatures. (A to C) GAS cells grown at either 30°C or 37°C were immunolabeled with anti-FctA antiserum (A), anti-Emm antiserum (B), and nonimmunized mouse serum (C), followed by staining with Alexa fluor 594-labeled secondary antibody. Subsequently, the cells were counterstained with SYBR green. Bars, 5 μm. (D) Flow cytometric analysis of surface display of FctA (upper left and lower left panels) and M protein (upper right and lower right panels). For the detection of FctA, the WT (dark gray; left panels) and the cpa operon deletion mutant strain (light gray; left panels), grown to mid-exponential phase at 37°C (upper panels) and 30°C (lower panels), were labeled with anti-FctA serum and analyzed by FACS. As a negative control, nonimmune mouse serum was used (data not shown). As for the detection of M protein, the WT strain grown under the same conditions was labeled with anti-Emm antiserum (dark gray; right panels). Nonimmunized rabbit serum was used as a control for nonspecific antibody binding (light gray; right panels). Representative data from three experiments are shown.
FIG. 3.
FIG. 3.
Localization and expression of FctA and M protein on the GAS surface at different temperatures. (A to C) GAS cells grown at either 30°C or 37°C were immunolabeled with anti-FctA antiserum (A), anti-Emm antiserum (B), and nonimmunized mouse serum (C), followed by staining with Alexa fluor 594-labeled secondary antibody. Subsequently, the cells were counterstained with SYBR green. Bars, 5 μm. (D) Flow cytometric analysis of surface display of FctA (upper left and lower left panels) and M protein (upper right and lower right panels). For the detection of FctA, the WT (dark gray; left panels) and the cpa operon deletion mutant strain (light gray; left panels), grown to mid-exponential phase at 37°C (upper panels) and 30°C (lower panels), were labeled with anti-FctA serum and analyzed by FACS. As a negative control, nonimmune mouse serum was used (data not shown). As for the detection of M protein, the WT strain grown under the same conditions was labeled with anti-Emm antiserum (dark gray; right panels). Nonimmunized rabbit serum was used as a control for nonspecific antibody binding (light gray; right panels). Representative data from three experiments are shown.
FIG. 4.
FIG. 4.
Detection of pilus-like structures by immunoblotting. An immunoblot of the cell wall fraction of GAS strains after reaction with antiserum against FctA is shown.
FIG. 5.
FIG. 5.
Immunogold staining of FctA and Cpa in the cpa operon-overexpressing GAS strain. (A) Immunogold labeling of FctA in the M49 GAS strain with cpa operon overexpression. Bar, 1.0 μm. (B) Colocalization of FctA and Cpa. FctA and Cpa were immunolabeled with 10- and 20-nm-diameter gold particles, respectively. Bar, 0.5 μm.
FIG. 6.
FIG. 6.
Binding of the WT and mutant strains to immobilized human matrix proteins. Microtiter plates were coated with the indicated matrix proteins (fibronectin [A], fibrinogen [B], laminin [C], collagen I [D], and collagen IV [E]) and subsequently incubated with the GAS strains. Binding was detected by anti-GAS polyclonal antibody and is represented by the A450. The data represent the mean values ± standard deviations for three independent experiments.
FIG. 7.
FIG. 7.
Adhesion to (A) and internalization into (B) human epithelial cells. HEp-2 cells were infected with the indicated GAS strains at a multiplicity of infection of 1:50. The adherence and internalization were measured and calculated as described in Materials and Methods. The data represent the mean values ± standard deviations for three independent experiments. The value for the WT strain was set to 100% for each independent test.
FIG. 8.
FIG. 8.
Survival of WT and sortase mutant strains in human whole blood. The blood survival assay was conducted with GAS strains and heparinized human whole blood. The number of surviving CFU was determined by plating serial dilutions and subsequent colony counting. The y axis shows the resulting multiplication factor for each strain calculated from the percentage of surviving CFU related to the inoculum CFU. Due to the high variability of this assay depending on the blood donor, only data for one representative experiment are shown. However, in three independent experiments with blood from different donors, the same general survival tendencies were noted. *, significantly different from WT levels (P < 0.05).
FIG. 9.
FIG. 9.
Biofilm formation of GAS M49 WT strain and FCT mutants at different temperatures. The capacity of GAS strains to form biofilms on polystyrene plates was quantified by staining with crystal violet. The GAS strains were cultured at 37°C for 24 h (A) or at 28°C for 48 h (B) in C medium.
FIG. 10.
FIG. 10.
Subcutaneous infection of SKH1 hairless mice with GAS M49 sortase mutants. (A) GAS strains (2 × 10⁸ CFU) in a mixture with Cytodex beads were used to infect SKH1 mice. Lesion sizes were examined daily for up to 5 days postinfection. The graph shows data from the evaluation at 3 days postinfection. The bars represent average values, and significance values are indicated. n.s., no significant difference, as determined by Student's t test. (B) Representative pictures of mice were taken at 3 days postinfection.

Similar articles

Cited by

References

    1. Abbot, E. L., W. D. Smith, G. P. Siou, C. Chiriboga, R. J. Smith, J. A. Wilson, B. H. Hirst, and M. A. Kehoe. 2007. Pili mediate specific adhesion of Streptococcus pyogenes to human tonsil and skin. Cell. Microbiol. 91822-1833. - PubMed
    1. Bae, T., and O. Schneewind. 2003. The YSIRK-G/S motif of staphylococcal protein A and its role in efficiency of signal peptide processing. J. Bacteriol. 1852910-2919. - PMC - PubMed
    1. Barnett, T. C., A. R. Patel, and J. R. Scott. 2004. A novel sortase, SrtC2, from Streptococcus pyogenes anchors a surface protein containing a QVPTGV motif to the cell wall. J. Bacteriol. 1865865-5875. - PMC - PubMed
    1. Barnett, T. C., and J. R. Scott. 2002. Differential recognition of surface proteins in Streptococcus pyogenes by two sortase gene homologs. J. Bacteriol. 1842181-2191. - PMC - PubMed
    1. Barocchi, M. A., J. Ries, X. Zogaj, C. Hemsley, B. Albiger, A. Kanth, S. Dahlberg, J. Fernebro, M. Moschioni, V. Masignani, K. Hultenby, A. R. Taddei, K. Beiter, F. Wartha, A. von Euler, A. Covacci, D. W. Holden, S. Normark, R. Rappuoli, and B. Henriques-Normark. 2006. A pneumococcal pilus influences virulence and host inflammatory responses. Proc. Natl. Acad. Sci. USA 1032857-2862. - PMC - PubMed

Publication types

MeSH terms

LinkOut - more resources