. 2008 Dec;28(24):7394-401.
doi: 10.1128/MCB.01087-08. Epub 2008 Oct 13.

Failure of terminal erythroid differentiation in EKLF-deficient mice is associated with cell cycle perturbation and reduced expression of E2F2

Affiliations

Failure of terminal erythroid differentiation in EKLF-deficient mice is associated with cell cycle perturbation and reduced expression of E2F2

Andre M Pilon et al. Mol Cell Biol. 2008 Dec.

Abstract

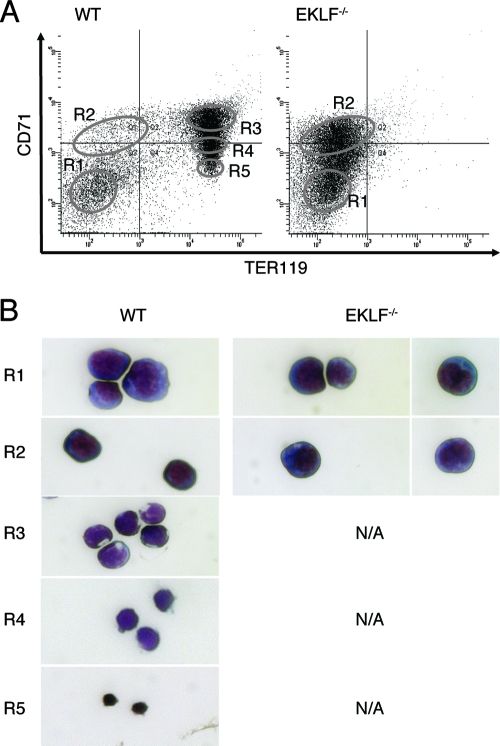
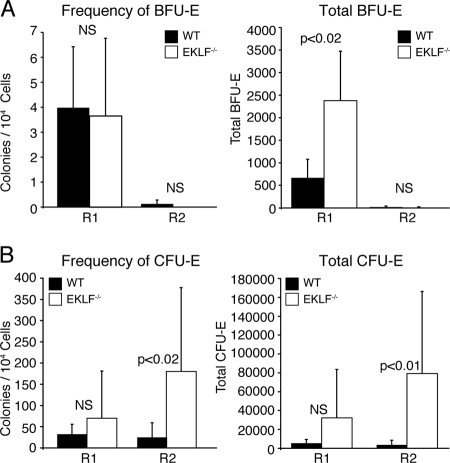
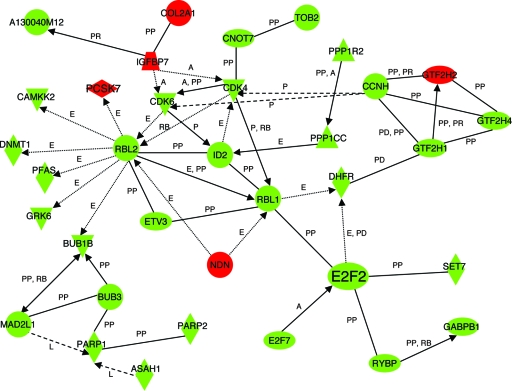
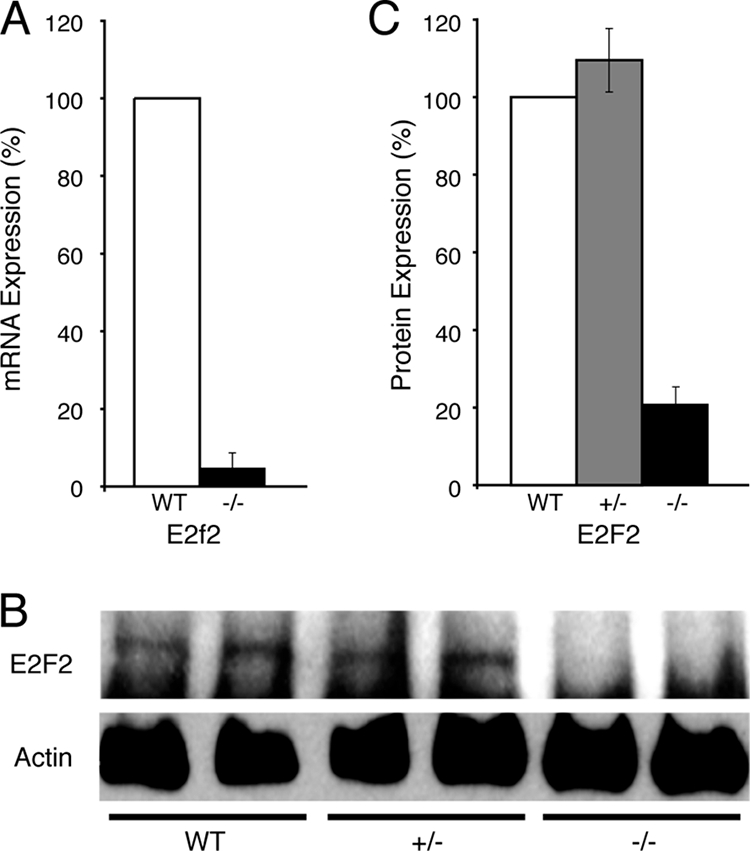
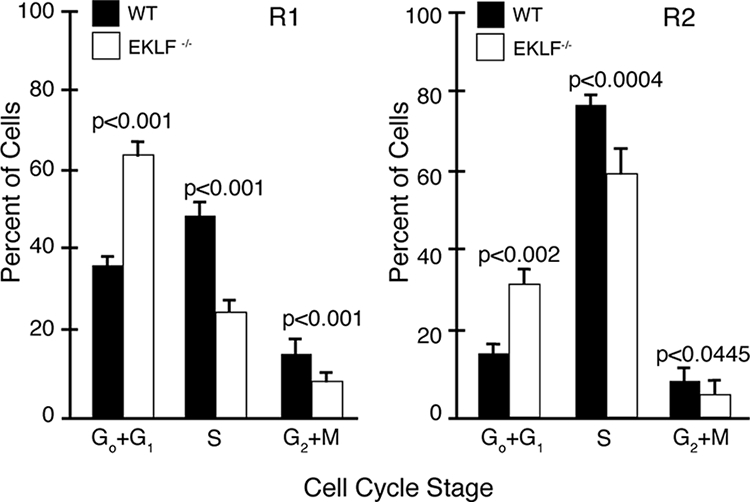
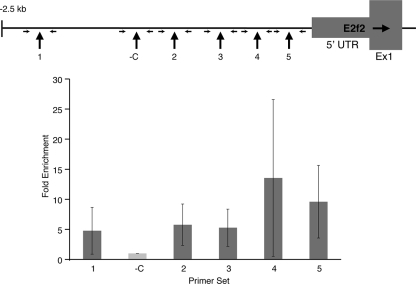
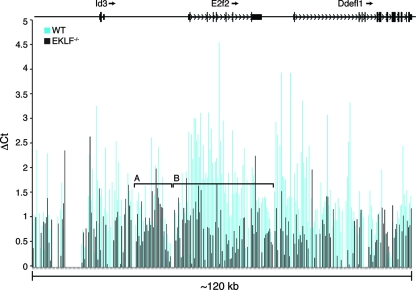
Erythroid Krüppel-like factor (EKLF) is a Krüppel-like transcription factor identified as a transcriptional activator and chromatin modifier in erythroid cells. EKLF-deficient (Eklf(-/-)) mice die at day 14.5 of gestation from severe anemia. In this study, we demonstrate that early progenitor cells fail to undergo terminal erythroid differentiation in Eklf(-/-) embryos. To discover potential EKLF target genes responsible for the failure of erythropoiesis, transcriptional profiling was performed with RNA from wild-type and Eklf(-/-) early erythroid progenitor cells. These analyses identified significant perturbation of a network of genes involved in cell cycle regulation, with the critical regulator of the cell cycle, E2f2, at a hub. E2f2 mRNA and protein levels were markedly decreased in Eklf(-/-) early erythroid progenitor cells, which showed a delay in the G(1)-to-S-phase transition. Chromatin immunoprecipitation analysis demonstrated EKLF occupancy at the proximal E2f2 promoter in vivo. Consistent with the role of EKLF as a chromatin modifier, EKLF binding sites in the E2f2 promoter were located in a region of EKLF-dependent DNase I sensitivity in early erythroid progenitor cells. We propose a model in which EKLF-dependent activation and modification of the E2f2 locus is required for cell cycle progression preceding terminal erythroid differentiation.


Figures

FIG. 1.
FIG. 1.
(A) Fluorescence-activated cell sorting analysis of E13.5 fetal liver cells from wild-type and Eklf−/− embryos. The cells were stained with anti-CD71 (transferrin receptor; y axis) and TER119 (x axis) antibodies. The sorting windows for the R1-R5 populations are indicated by the labeled ovals. (B) Morphology of representative Wright-Giemsa-stained cells in the sorted R1-R5 populations. Wild-type R1 was composed of 98% large blast cells and 2% other cells, wild-type R2 was composed of 99% smaller blast cells and 1% other cells, wild-type R3 was composed of 99% smaller hemoglobin-staining cells with compacted nuclei and 1% other cells, wild-type R4 was composed of 99% cells with dark hemoglobin staining and decentralized nuclei and 1% other cells, and wild-type R5 was composed of 99% reticulocytes and 1% other cells. Eklf−/− R1 was composed of 97.5% large blast cells and 2.5% other cells, while Eklf−/− R2 was composed of 97% smaller blast cells and 3% other cells. WT, wild type.
FIG. 2.
FIG. 2.
Analysis of erythroid colony forming cells in E13.5 fetal liver cells from wild-type and Eklf−/− embryos. Fetal liver cells were sorted using the windows depicted in Fig. 1. The R1 and R2 populations were isolated and suspended in semisolid medium. The black bars represent the average number of colonies from wild-type cells (with the standard deviation), and the open bars represent the average number of colonies from Eklf−/− cells (with the standard deviation). (A) Frequency and total number of BFU-E colonies. BFU-E colonies were counted on days 10 to 12 (wild type) and days 13 to 15 (Eklf−/−) of culture. (B) Frequency and total number of CFU-E colonies. CFU-E colonies were counted on day 2 to 3 (WT) and day 3 to 5 (Eklf−/−) of culture. The P values for the significant differences between wild type and Eklf−/− are shown. NS, not significant. There was no significant difference in the frequency or absolute number of CFU-GM in wild-type and Eklf−/− fetal liver cells. The total numbers of colonies were calculated as follows: (number of colonies/10,000 R1 or R2 cells) × (number of R1 or R2 cells/total fetal liver cells) × the total number fetal liver cells. WT, wild type.
FIG. 3.
FIG. 3.
Network of differentially expressed genes in the cell cycle control pathway in sorted R1/R2 Eklf−/− E13.5 fetal liver cells. IPA was performed on microarray data comparing R1 and R2 mRNA isolated from wild-type and Eklf−/− E13.5 fetal liver cells. Using 3,199 differentially expressed genes as the focus gene set, the highest-scoring pathway was cell cycle and DNA replication (score = 27; scores >3 indicate a significant chance that a biologically relevant network has been identified). Red nodes indicate upregulation in Eklf−/− cells; green nodes indicate downregulation in Eklf−/− cells. Arrows and lines denote interactions between specific genes within the network. A, activation; E, expression regulation; P, phosphorylation; PP, protein-protein interaction; PD, protein-DNA interaction; PR, protein-RNA interaction; RB, regulation of binding; L, proteolysis.
FIG. 4.
FIG. 4.
Verification of decreased levels of E2f2 in sorted R1/R2 cells from E13.5 wild-type and Eklf−/− fetal livers. (A) Quantitative RT-PCR analysis of E2f2 mRNA in sorted R1/R2 cells from E13.5 wild-type and Eklf−/− (−/−) embryos. The mean mRNA levels (with the standard deviation) are related to the level in wild-type cells (designated 100%). (B) Representative Western blot of E2F2 protein levels in sorted R1/R2 cells from E13.5 wild-type, heterozygous Eklf+/− (+/−) and Eklf−/− (−/−) embryos. Actin levels are shown as controls. (C) Relative E2F2 protein levels (with the standard deviation) in sorted R1/R2 cells from E13.5 wild-type, heterozygous Eklf+/− (+/−), and Eklf−/− (−/−) embryos. The mean protein levels of each genotype were quantified by using a Molecular Dynamics Storm 860 scanner and are normalized to the level in wild-type cells (designated 100%). WT, wild type.
FIG. 5.
FIG. 5.
Analysis of cell cycle in sorted R1 and R2 E13.5 fetal liver cells from wild-type and Eklf−/− embryos. Fetal liver cells were sorted into R1 and R2 populations using the windows depicted in Fig. 1 and analyzed for DNA content with propidium iodide. The bars represent the average percentage of cells (with the standard deviation; y axis) at each stage of the cell cycle (x axis). Black bars represent cells sorted from wild-type fetal liver, and the open bars represent cells sorted from Eklf−/− fetal liver. (Left panel) Cell cycle analysis of R1 cells; (right panel) cell cycle analysis of R2 cells. WT, wild type.
FIG. 6.
FIG. 6.
ChIP analysis of the E2f2 promoter region in sorted R1/R2 E13.5 fetal liver cells from wild-type embryos expressing HA-EKLF. Chromatin fragments were precipitated with anti-HA antibody and amplified with six sets of primers from the E2f2 promoter region. Regions 1 to 5 contain one or more consensus EKLF binding motifs (NCNCNCCCN). The negative control region (-C) does not contain an EKLF binding motif. The location of the primers flanking each region is indicated. The dark gray bars represent the enrichment of each sequence relative to the -C region (gray bar; designated as 1.0).
FIG. 7.
FIG. 7.
DNase I sensitivity analysis of the mouse E2f2 locus in sorted R1/R2 E13.5 fetal liver cells from wild-type and Eklf−/− embryos. DNA was extracted from the nuclei of sorted cells treated with or without DNase I. The DNA was amplified with a series of 287 primers spanning the E2f2 gene plus 50 kb of 5′ and 3′ flanking DNA by using a real-time PCR assay. The top of the figure shows the location of the E2f2 and the flanking loci on mouse chromosome 4. The paired vertical bars represent the DNase I sensitivity at each point in this region. DNase I sensitivity was calculated by subtracting the average number of cycles needed to amplify a specific amount of product in untreated DNA from the average number of cycles needed to amplify the same amount of product in the DNase-treated DNA. The results are the means of triplicate analyses of each point in a composite of three or four (depending on the region) independent experiments. The blue bars represent the signals in DNA extracted from wild-type chromatin. The black bars represent the signals in DNA extracted from Eklf−/− chromatin. The mean level of DNase digestion in the region indicated by bracket A is similar in wild-type and Eklf−/− chromatin. The mean level of DNase digestion in the region indicated by bracket B is significantly greater in wild-type chromatin compared to Eklf−/− chromatin (P < 0.001). WT, wild type.

Similar articles

Cited by

References

    1. Adams, P. D., and W. G. Kaelin, Jr. 1995. Transcriptional control by E2F. Semin. Cancer Biol. 699-108. - PubMed
    1. Alter, B. P., S. C. Goff, G. D. Efremov, M. E. Gravely, and T. H. Huisman. 1980. Globin chain electrophoresis: a new approach to the determination of the G gamma/A gamma ratio in fetal haemoglobin and to studies of globin synthesis. Br. J. Haematol 44527-534. - PubMed
    1. Alter, B. P., B. T. Jackson, J. M. Lipton, G. J. Piasecki, P. L. Jackson, M. Kudisch, and D. G. Nathan. 1981. Control of the simian fetal hemoglobin switch at the progenitor cell level. J. Clin. Investig. 67458-466. - PMC - PubMed
    1. Armstrong, J. A., J. J. Bieker, and B. M. Emerson. 1998. A SWI/SNF-related chromatin remodeling complex, E-RC1, is required for tissue-specific transcriptional regulation by EKLF in vitro. Cell 9593-104. - PubMed
    1. Bernat, J. A., G. E. Crawford, A. Y. Ogurtsov, F. S. Collins, D. Ginsburg, and A. S. Kondrashov. 2006. Distant conserved sequences flanking endothelial-specific promoters contain tissue-specific DNase-hypersensitive sites and over-represented motifs. Hum. Mol. Genet. 152098-2105. - PubMed

Publication types

MeSH terms

Substances