. 2008 Dec;28(24):7368-79.
doi: 10.1128/MCB.00744-08. Epub 2008 Oct 13.

A genome-wide screen for beta-catenin binding sites identifies a downstream enhancer element that controls c-Myc gene expression

Affiliations

A genome-wide screen for beta-catenin binding sites identifies a downstream enhancer element that controls c-Myc gene expression

Gregory S Yochum et al. Mol Cell Biol. 2008 Dec.

Abstract

Mutations in components of the Wnt signaling pathway initiate colorectal carcinogenesis by deregulating the beta-catenin transcriptional coactivator. beta-Catenin activation of one target in particular, the c-Myc proto-oncogene, is required for colon cancer pathogenesis. beta-Catenin is known to regulate c-Myc expression via sequences upstream of the transcription start site. Here, we report that a more robust beta-catenin binding region localizes 1.4 kb downstream from the c-Myc transcriptional stop site. This site was discovered using a genome-wide method for identifying transcription factor binding sites termed serial analysis of chromatin occupancy. Chromatin immunoprecipitation-scanning assays demonstrate that the 5' enhancer and the 3' binding element are the only beta-catenin and TCF4 binding regions across the c-Myc locus. When placed downstream of a simian virus 40-driven promoter-luciferase construct, the 3' element activated luciferase transcription when introduced into HCT116 cells. c-Myc transcription is negligible in quiescent HCT116 cells but is induced when cells reenter the cell cycle after the addition of mitogens. Using these cells, we found that beta-catenin and TCF4 occupancy at the 3' enhancer precede occupancy at the 5' enhancer. Association of c-Jun, beta-catenin, and TCF4 specifically with the downstream enhancer underlies mitogen stimulation of c-Myc transcription. Our findings indicate that a downstream enhancer element provides the principal regulation of c-Myc expression.


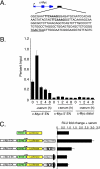
Figures

FIG. 1.
FIG. 1.
β-Catenin and TCF4 bind a region downstream from the c-Myc transcription stop site in HCT116 cells. (A) Diagram of the human c-Myc gene locus. The c-Myc gene is depicted in blue with exons as rectangles, introns as horizontal lines, and the 5′ and 3′ untranslated regions as thin rectangles. An arrow marks the transcription start site. Coordinates of the region of chromosome 8 (chr 8) that contains c-Myc are shown at the top. Below, a red rectangle identifies the characterized 5′ β-catenin/TCF enhancer (21), and the green vertical lines indicate the positions of the β-catenin GSTs identified in the SACO screen (54). Clustered vertical lines below indicate the degree of conservation across mammalian species. This representation was downloaded from the UCSC Genome Browser (http://genome.ucsc.edu/). (B) Real-time PCR analysis of DNA fragments precipitated in a ChIP assay by using an anti-β-catenin antibody (blue bars) or an anti-TCF4 antibody (red bars). Primers were designed to the 5′ promoters of cycD1 and c-Myc to detect specific β-catenin and TCF4 binding and to an internal region of tubulin, an internal region of β-actin, and a region downstream of cycD1 to monitor nonspecific interactions. The primers used to detect binding to the region downstream of c-Myc were designed adjacent to the β-catenin SACO GSTs. As a control, ChIP assays were conducted in TIG fibroblasts which lack appreciable levels of nuclear β-catenin. Data are presented as percent input signal, and error bars indicate standard errors of the means.
FIG. 2.
FIG. 2.
ChIP scanning analysis of the c-Myc genomic locus in HCT116 cells. (A) Red boxes correspond to the amplicons produced in PCRs using oligonucleotide primer sets designed across the c-Myc genomic locus. These amplicons are arbitrarily designated 1 to 16. Purple and green vertical lines indicate the positions of consensus TCF motifs and β-catenin SACO GSTs, respectively. c-Myc is depicted at the top of the diagram with an arrow marking the transcription start site. (B) Real-time PCR analysis of ChIP assays performed in HCT116 cells using antibodies directed against β-catenin (red bars), TCF4 (blue bars), or control β-galactosidase (gray bars). The amplicons produced in the real-time PCRs are labeled 1 to 16 along the x axis. Real-time PCR analysis of ChIP assays in HCT116 cells using anti-TBP (C), anti-RNAPII S5 (D), anti-RNAPII (E), or anti-H3K9/K14ac and anti-H3K4me3 (F) antibodies. Error bars indicate standard errors of the means.
FIG. 3.
FIG. 3.
The c-Myc 3′ β-catenin/TCF4 binding region enhances SV40 promoter-driven luciferase gene expression. (A) Diagram of reporter constructs with the SV40 promoter represented as green rectangles, and the firefly luciferase gene is shown as yellow rectangles. The rectangles labeled c-Myc 5′ EN correspond to the 588 bp β-catenin/TCF enhancer (21). The rectangles labeled c-Myc 3′ EN correspond to a 615-bp fragment that begins 1,410 bp downstream from the c-Myc transcription stop site and binds β-catenin and TCF4 in ChIP assays. An “X” indicates that a TCF consensus motif was mutated. (B) The firefly luciferase reporter plasmids, a control plasmid expressing Renilla luciferase, and plasmids encoding β-catenin S45F and Lef-1 were transfected into HEK293 cells. After 24 h, firefly luciferase levels were assayed and normalized to Renilla luciferase levels. The activities of the respective reporters are aligned with their schematic representations. Activity is represented as relative change in the presence of β-catenin and Lef-1 and is normalized to background β-catenin/Lef-1 activation of the pGL3-promoter vector. (C) HCT116 cells were transfected with the indicated firefly luciferase reporters and a control Renilla luciferase plasmid. Luciferase activities were measured as in HEK293 cells, and data are represented as the change in expression relative to levels obtained with the pGL3-promoter vector alone. Error bars indicate standard deviations.
FIG. 4.
FIG. 4.
The c-Myc 3′ enhancer activates transcription in a position- and orientation-independent manner. (Left) Diagram of reporter constructs with the SV40 promoter represented as green rectangles and the firefly luciferase gene shown as yellow rectangles. The rectangles labeled c-Myc 3′ EN (REV) correspond to the 615 bp c-Myc 3′ element inserted in reverse orientation relative to the SV40 promoter. DNA spacers corresponding to 1-kb fragments from the pBluescript plasmid are indicated. The firefly luciferase reporter plasmids and a control plasmid expressing Renilla luciferase were transfected into HCT116 cells. Luciferase levels were measured 24 h following transfection. Firefly luciferase values were normalized to Renilla luciferase values, and the data are represented as the change in expression relative to levels in cells transfected with the pGL3-promoter vector and control Renilla vector. Error bars indicate standard deviations.
FIG. 5.
FIG. 5.
c-Myc expression is tightly regulated in synchronized HCT116 cells. (A) FACS profiles of propidium iodide-stained HCT116 cells that were serum deprived for 48 h and then cultured in the presence of serum-containing medium for the number of hours indicated at the top of each panel. FL2-H is peak emission values of propidium iodide-stained DNA fluorescence. (B) RNAs were isolated from HCT116 cells treated as described for panel A, and cDNA was synthesized using a random primer and avian myeloblastosis virus reverse transcriptase. Real-time quantitative PCR was conducted using primers designed against the third exon of c-Myc or the fourth exon of tubulin as an internal control. The data are presented as relative c-Myc mRNA levels normalized to tubulin. Error bars indicate standard errors of the means. (C) Protein extracts prepared from HCT116 cells synchronized as in panel A were subjected to sodium dodecyl sulfate-polyacrylamide gel electrophoresis and probed with anti-c-Myc, anti-β-catenin, anti-TCF4, or antitubulin antibodies in a Western blot.
FIG. 6.
FIG. 6.
β-Catenin, TCF4, and transcriptional regulatory factors assemble at the c-Myc 3′ enhancer prior to binding to the 5′ c-Myc promoter following exposure of arrested HCT116 cells to serum. (A) Real-time PCR analysis of ChIP assays using anti-β-catenin or anti-TCF4 antibodies to precipitate chromatin isolated from serum-starved cells (0) and starved cells released into serum for 1, 2, 4, or 8 h. Primers specific to the 5′ c-Myc promoter and the c-Myc 3′ enhancer (primer set 5 and set 13, respectively) (Fig. 2A) were used in the real-time PCRs. (B to D) Real-time PCR analysis as in panel A except that anti-TFIIB (B), anti-H3K4me3 (C), or anti-H3K9/K14ac (D) antibodies were used in the ChIP assays. Error bars indicate standard errors of the means.
FIG. 7.
FIG. 7.
β-Catenin and the TCF-responsive sites in the c-Myc 3′ enhancer are required for mitogen-dependent activation of c-Myc gene expression. (A) HT29-APC cells were synchronized in the cell cycle by serum withdrawal for 48 h followed by addition of serum-containing medium for 1, 2, 4, or 8 h. Where indicated, 100 μM ZnCl2 was included in the medium. ZnCl2 induces expression of a transgene encoding full-length APC in the HT29-APC cells (29). At each time point, RNAs were isolated and reverse transcribed using avian myeloblastosis virus reverse transcriptase, and the synthesized cDNA was amplified in real-time PCRs using APC-, c-Myc-, or tubulin-specific primer sets. Each point is normalized to signal generated with tubulin primers as an internal control. Error bars indicate standard errors of the means. (B) Protein extracts prepared from HT29-APC cells treated as in panel A were subjected to sodium dodecyl sulfate-polyacrylamide gel electrophoresis and probed with anti-c-Myc- or anti-β-catenin-specific antibodies in Western blotting. Whole-cell extracts were used in the c-Myc experiment while nuclear extracts were used in the β-catenin experiment. (C) Real-time PCR analysis of the c-Myc 3′ enhancer precipitated from HT29-APC cells with anti-β-catenin antibodies in a ChIP assay. Prior to the ChIP, HT29-APC cells were serum starved for 48 h (0), and then serum was added for 1 or 2 h in the presence or absence of ZnCl2 as indicated. Error bars indicate standard errors of the means. (D) The luciferase constructs diagrammed above the graph were transfected into HCT116 cells and, the following day, medium lacking serum was added. After 48 h, serum was added for 1, 2, or 4 h, and then levels of luciferase were quantified. Both TCF4 consensus sequences within the 3′ enhancer are mutated in the construct labeled 5′EN/3′EN (mut TBE3/4). Error bars indicate standard deviations. EN, enhancer; X, mutation in a TCF consensus motif.
FIG. 8.
FIG. 8.
AP-1 is involved in β-catenin/TCF-dependent activation of c-Myc expression in response to mitogens. (A) Diagram of the c-Myc gene (blue) with the 3′ enhancer represented by a black rectangle. The sequence of a 158-bp segment from the enhancer containing two TCF motifs (bold) and an AP-1 motif (underlined) is shown. (B) Real-time PCR analysis of ChIP assays using an anti-c-Jun-specific antibody was conducted in starved (0) HCT116 cells and starved cells cultured in serum-containing medium for 1, 2, 4, or 8 h. Error bars indicate standard errors of the means. (C) Diagram of luciferase constructs where X indicates mutation in the TCF motif, and a black oval indicates a mutation in the AP-1 motif. HCT116 cells were transfected with the indicated luciferase reporters. The next day, cells were starved in serum-deprived medium for 48 h. Serum-containing medium was added to half of the samples for 4 h, and luciferase activities were measured in cell lysates. Data are presented as the relative change in luciferase activity (in relative light units [RLU]) in response to serum and are normalized to levels obtained in cells transfected with pGL3-promoter. Error bars indicate standard deviations. EN, enhancer.

Similar articles

Cited by

References

    1. Armstrong, B. C., and G. W. Krystal. 1992. Isolation and characterization of complementary DNA for N-cym, a gene encoded by the DNA strand opposite to N-myc. Cell Growth Differ. 3385-390. - PubMed
    1. Banerji, J., S. Rusconi, and W. Schaffner. 1981. Expression of a beta-globin gene is enhanced by remote SV40 DNA sequences. Cell 27299-308. - PubMed
    1. Barski, A., S. Cuddapah, K. Cui, T. Y. Roh, D. E. Schones, Z. Wang, G. Wei, I. Chepelev, and K. Zhao. 2007. High-resolution profiling of histone methylations in the human genome. Cell 129823-837. - PubMed
    1. Berger, S. L. 2007. The complex language of chromatin regulation during transcription. Nature 447407-412. - PubMed
    1. Bommer, G. T., and E. R. Fearon. 2007. Role of c-Myc in Apc mutant intestinal phenotype: case closed or time for a new beginning? Cancer Cell 11391-394. - PubMed

Publication types

MeSH terms

LinkOut - more resources