. 2008 Oct 20;183(2):253-65.
doi: 10.1083/jcb.200711150. Epub 2008 Oct 13.

The HINT1 tumor suppressor regulates both gamma-H2AX and ATM in response to DNA damage

Affiliations

The HINT1 tumor suppressor regulates both gamma-H2AX and ATM in response to DNA damage

Haiyang Li et al. J Cell Biol. .

Abstract

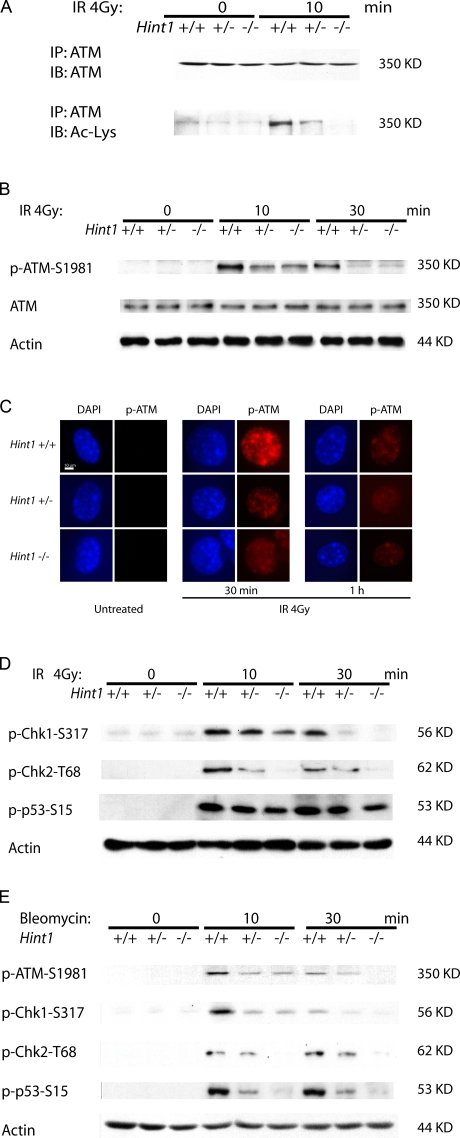
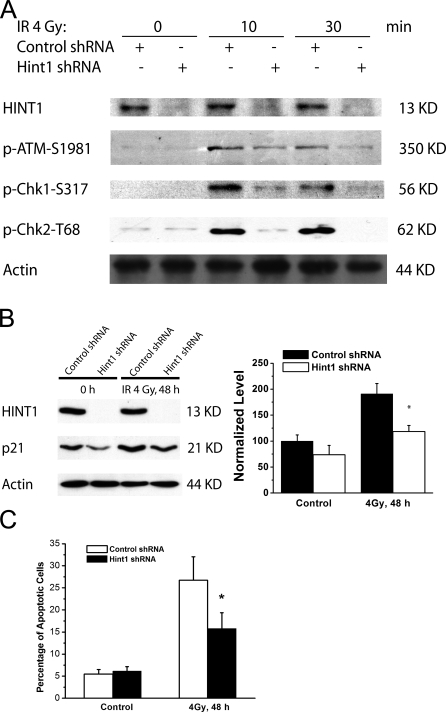
Hint1 is a haploinsufficient tumor suppressor gene and the underlying molecular mechanisms for its tumor suppressor function are unknown. In this study we demonstrate that HINT1 participates in ionizing radiation (IR)-induced DNA damage responses. In response to IR, HINT1 is recruited to IR-induced foci (IRIF) and associates with gamma-H2AX and ATM. HINT1 deficiency does not affect the formation of gamma-H2AX foci; however, it impairs the removal of gamma-H2AX foci after DNA damage and this is associated with impaired acetylation of gamma-H2AX. HINT1 deficiency also impairs acetylation of ATM and activation of ATM and its downstream effectors, and retards DNA repair, in response to IR. HINT1-deficient cells exhibit resistance to IR-induced apoptosis and several types of chromosomal abnormalities. Our findings suggest that the tumor suppressor function of HINT1 is caused by, at least in part, its normal role in enhancing cellular responses to DNA damage by regulating the functions of both gamma-H2AX and ATM.


Figures

Figure 1.
Figure 1.
HINT1-deficient MEFs display prolonged γ-H2AX staining and impaired acetylation of γ-H2AX. (A) Real-time RT-PCR quantification of mRNA levels in exponential growing Hint1 MEFs. †, P < 0.0001 compared with Hint1 +/+ MEFs. (B) Immunoblot analysis of HINT1 expression in exponential growing Hint1 MEFs. Densitometry analysis was performed on four independent blots. (C) Hint1 MEFs were untreated (0 min) or treated with 4 Gy of IR, and were then fixed after the indicated times. Cells were stained with an anti–γ-H2AX antibody and counterstained for the nucleus with DAPI. Cells with five or more γ-H2AX foci were considered positive. The percentage of positive cells was determined in 500 cells per slide and plotted against the time after treatment. Three repeat experiments were performed and mean and standard deviations were determined. *, P < 0.05 compared with Hint1 +/+ MEFs; **, P < 0.05 compared with both Hint1 +/+ and +/− MEFs. (D) Hint1 MEFs were untreated (control) or treated with 4 Gy of IR, and were fixed after the indicated times. Cells were stained with Rad50 (green) and γ-H2AX antibody (red), and counterstained for the nucleus with DAPI (blue). Images were merged using the ImageJ software. Representative micrographs of Hint1 MEFs are shown. Bars, 10 μm. (E) Hint1 MEFs were untreated (0) or treated with 4 Gy of IR, and whole cell lysates were collected after the indicated times. Immunoprecipitates were obtained using a γ-H2AX antibody or mock mouse IgG (lane M) and resolved by SDS-PAGE. Immunoblots were then performed using a γ-H2AX antibody, an acetyllysine antibody, or an ac-H2A(K5) antibody. Error bars represent the standard deviation of data from triplicate experiments. Repeat studies gave similar results.
Figure 2.
Figure 2.
The HINT1 protein is recruited to IRIF and associates with γ-H2AX. (A) Hint1 −/− MEFs were transiently transfected with FLAG-Hint1, grown on coverslips, and treated with 4 Gy of IR. Cells were then fixed after the indicated times and stained with an anti-FLAG antibody (green) together with an anti–γ-H2AX antibody (red) and counterstained for the nucleus with DAPI. Adjacent cells not expressing FLAG-Hint1 were used as an internal negative control. Repeat studies gave similar results. (B) The kinetics of HINT1 and γ-H2AX nuclear foci formation before and after IR treatment. For each genotype and time point, the number of foci per cell was analyzed in 20 images (error bars represent standard deviation). (C) Hint1 −/− MEFs were transiently transfected with FLAG-Hint1 or the control vector (p3xFLAG). 48 h later cells were treated with or without 4 Gy of IR, and whole cell lysates were prepared for immunoprecipitation using the FLAG antibody. Immunoblots were performed using either a FLAG antibody, a γ-H2AX antibody, or an ATM antibody. Repeat studies gave similar results. *, P < 0.05 compared with untreated cells.
Figure 3.
Figure 3.
Loss of HINT1 impairs the acetylation and activation of ATM. (A) Hint1 MEFs were untreated or treated with 4 Gy of IR, and whole cell lysates were collected after 10 min. Immunoprecipitates were obtained using an anti-ATM antibody and resolved on SDS-PAGE. Immunoblots were then performed using either an ATM antibody or an acetyllysine antibody. (B) Hint1 +/+, +/−, and −/− MEFs were untreated (0) or treated with 4 Gy of IR. After the indicted times, cell lysates were collected and immunoblot analyses done for the levels of p-ATM-S1981 and ATM. Actin was used as an internal loading control. (C) Hint1 +/+, +/−, and −/− MEFs were untreated or treated with 4 Gy of IR and fixed after the indicated times. Cells were then stained with an antibody to p-ATM-S1981 (red) and counterstained for the nucleus with DAPI (blue). Bar, 10 μm. (D and E) Cell lysates from Hint1 MEFs untreated (0) or treated with 4 Gy of IR (D) or 100 nM bleomycin (E) were collected at the indicated times, and immunoblot analyses were done for the levels of p-Chk1-S317, p-Chk2-T68, and p-p53-S15. A repeated experiment yielded similar results.
Figure 4.
Figure 4.
Loss of HINT1 is associated with reduced activation of IR-inducible genes. (A) Hint1 MEFs were untreated or treated with 4 Gy of IR, and total RNA was collected after the indicated time points. The mRNA levels of p21, GADD45α, GADD153, and TP53inp1 were determined by real-time RT-PCR. (B) Whole cell lysates of control or IR (4 Gy)-treated Hint1 MEFs were collected for immunoblot analysis of the level of the p21 protein. Actin was used as a loading control. Error bars represent standard deviation from triplicate experiments. *, P < 0.05 when compared with Hint1 +/+ MEFs at each time point; §, P < 0.05 when compared with Hint1 +/− MEFs.
Figure 5.
Figure 5.
Loss of HINT1 causes resistance to IR-induced apoptosis. SW480 cells were transfected with control shRNA or Hint1-shRNA and selected with G418, and then stable clones were pooled. (A) Whole cell lysates collected at the indicated times from untreated or IR (4 Gy)-treated pools were used for immunoblot analysis of HINT1, p-ATM-S1981, p-Chk1-S317, and p-Chk2-T68. Actin was used as a loading control. (B) Whole cell lysates of control or IR (4 Gy)-treated pools were collected for immunoblot analysis of the level of the p21 protein. Actin was used as a loading control. (C) Control SW480 pools and SW480 pools in which HINT1 was stably knocked down by shRNA were either untreated (0 h) or treated with 4 Gy of IR. Apoptotic cells were analyzed by sub-G1 content using a flow cytometry method. A repeat experiment yielded similar results. Error bars represent the standard deviation from triplicate experiments. *, P < 0.05 when compared with the control shRNA-transfected cells at each time point.
Figure 6.
Figure 6.
HINT1-deficient MEFs display retarded DNA rejoining. (A and B) Analysis of time course kinetics of DNA rejoining by alkaline comet assay. Hint1 MEFs were irradiated with 4 Gy of γ radiation on ice and postincubated for the indicated recovery times. Comet slides were prepared, lysed in an alkaline buffer, and electrophoresed. Comet images were captured using a fluorescent microscope, and the tail moment was analyzed in 100 randomly chosen comets using comet analysis software. Representative comet images and the histogram of cell number versus tail moment (A) and the mean of tail moments observed at different times are shown (B). *, P < 0.005 compared with Hint1 +/+ MEFs (nonparametric Mann-Whitney test). A repeat experiment gave similar results. (C) PFGE analysis of DNA DSB repair in Hint1 MEFs. Hint1 MEFs were irradiated with 40 Gy of γ radiation on ice and postincubated for the indicated recovery times. Agarose plugs were prepared, cells were lysed by proteinase K, and genomic DNA was electrophoresed. The percentage of DSB unrepaired were calculated and DNA-PKcs −/− MEFs were used for comparison. Error bars represent the standard deviation from triplicate experiments. *, P < 0.05 compared with Hint1 +/+ MEFs (Student's t test).
Figure 7.
Figure 7.
HINT1-deficient cells display increased chromosome aberrations. Hint1 MEFS were treated with or without a 4-Gy dose of IR and 18 h later were treated with cytochalasin B for 22 h. Cells were then fixed and stained with Acridine orange for the analysis of chromosomal abnormalities. (A) Representative images showing normal binuclear morphology of untreated Hint1 +/+ MEF and chromosome aberrations in untreated Hint1 −/− MEFs, including micronuclei (top right), unequal division (middle left), nuclear blebbing (middle right), chromatin bridge (bottom left), and multinucleation (bottom right). (B) Micronuclei frequency per binucleated cell was compared in Hint1 MEFs untreated or treated with 4 Gy of IR. (C) Chromosomal abnormality frequencies of the indicated type per binucleated cell were compared in Hint1 MEFs untreated or treated with 4 Gy of IR. (D) Telomere labeling of Hint1 +/+ and −/− MEFs. CF, centromeric fragment; CB, chromosome break; arrows, chromatid breaks. (E) Chromosomal analysis of Hint1 +/+ and −/− MEFs. *, P < 0.05 when compared with the +/+ MEFs (Fisher's exact test).

References

    1. Ahel, I., U. Rass, S.F. El-Khamisy, S. Katyal, P.M. Clements, P.J. McKinnon, K.W. Caldecott, and S.C. West. 2006. The neurodegenerative disease protein aprataxin resolves abortive DNA ligation intermediates. Nature. 443:713–716. - PubMed
    1. Ajit, S.K., S. Ramineni, W. Edris, R.A. Hunt, W.T. Hum, J.R. Hepler, and K.H. Young. 2007. RGSZ1 interacts with protein kinase C interacting protein PKCI-1 and modulates mu opioid receptor signaling. Cell. Signal. 19:723–730. - PubMed
    1. Bakkenist, C.J., and M.B. Kastan. 2003. DNA damage activates ATM through intermolecular autophosphorylation and dimer dissociation. Nature. 421:499–506. - PubMed
    1. Balajee, A.S., and C.R. Geard. 2004. Replication protein A and gamma-H2AX foci assembly is triggered by cellular response to DNA double-strand breaks. Exp. Cell Res. 300:320–334. - PubMed
    1. Barlow, C., K.D. Brown, C.X. Deng, D.A. Tagle, and A. Wynshaw-Boris. 1997. Atm selectively regulates distinct p53-dependent cell-cycle checkpoint and apoptotic pathways. Nat. Genet. 17:453–456. - PubMed

Publication types

MeSH terms