. 2008 Oct 21;105(42):16290-5.
doi: 10.1073/pnas.0807404105. Epub 2008 Oct 13.

The transcriptome of Plasmodium vivax reveals divergence and diversity of transcriptional regulation in malaria parasites

Affiliations

The transcriptome of Plasmodium vivax reveals divergence and diversity of transcriptional regulation in malaria parasites

Zbynek Bozdech et al. Proc Natl Acad Sci U S A. .

Abstract

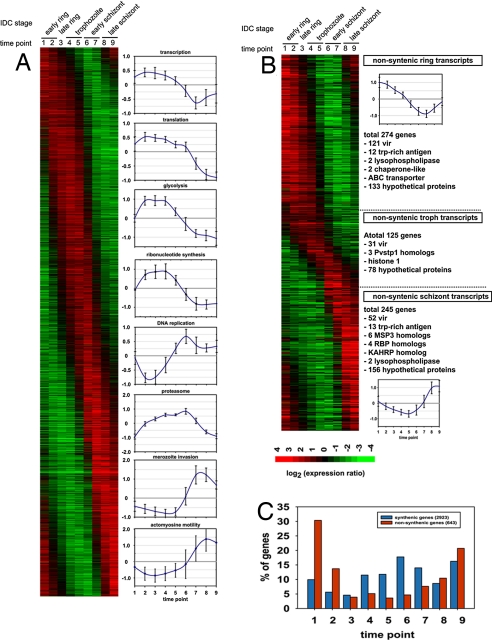
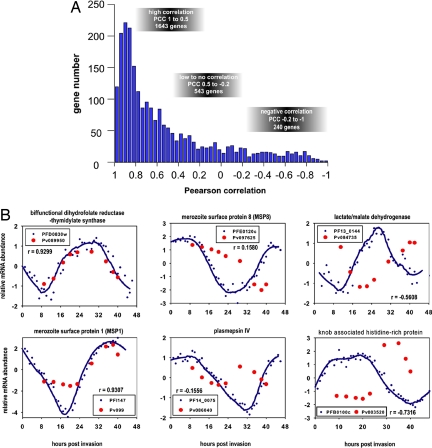
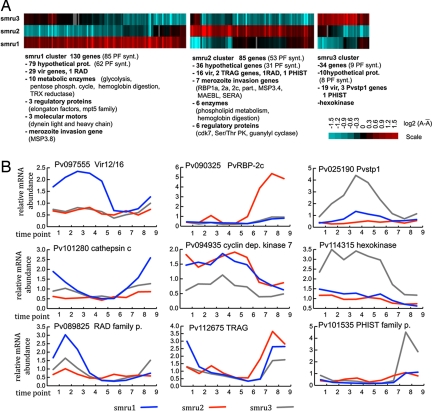
Plasmodium vivax causes over 100 million clinical infections each year. Primarily because of the lack of a suitable culture system, our understanding of the biology of this parasite lags significantly behind that of the more deadly species P. falciparum. Here, we present the complete transcriptional profile throughout the 48-h intraerythrocytic cycle of three distinct P. vivax isolates. This approach identifies strain specific patterns of expression for subsets of genes predicted to encode proteins associated with virulence and host pathogen interactions. Comparison to P. falciparum revealed significant differences in the expression of genes involved in crucial cellular functions that underpin the biological differences between the two parasite species. These data provide insights into the biology of P. vivax and constitute an important resource for the development of therapeutic approaches.


Conflict of interest statement

The authors declare no conflict of interest.

Figures

Fig. 1.
Fig. 1.
Transcriptome of the P. vivax IDC. (A and B) A total 3,566 genes exhibit >2-fold change in mRNA abundance across the P. vivax IDC. The assembled phaseograms represents the transcriptome of a single P. vivax isolate (smru1), and it includes 2,923 genes with a P. falciparum syntenic ortholog (A) and 643 genes without (B). Both IDC transcriptome phaseograms were assembled from the microarray expression profiles in which the values were log2 transformed, and each profile was mean centered. The expression profiles are ordered by the phase of the major periodic component calculated by the Fast Fourier Transformation as described (6). (A) The plots indicate the average expression profiles and standard deviations of expression values for genes that belong to functional groups with synchronized expression during the P. falciparum IDC (6). (B) The nonsyntenic genes are classified into ring, trophozoite, or schizont transcripts based on the time of their peak expression. Representative examples of P. vivax stage specific genes or gene families are listed next to each section of the phaseogram that correspond to individual developmental stages (ring, trophozoite, schizont). (C) The histogram depicts a relative distribution of genes with peak expression in each time point for the syntenic and nonsyntenic gene groups.
Fig. 2.
Fig. 2.
Comparative analyses of P. vivax and P. falciparum IDC transcriptomes. Using the best fit Pearson correlations, we correlate gene expression data in TP1–9 in P. vivax to the expression data in TP 9, 13, 17, 20, 23, 29, 35, 40, and 43 in the P. falciparum transcriptome (Fig. S2). (A) Histogram of the overall distribution of Pearson correlation coefficients (PCCs) for 2,426 P. vivax–P. falciparum gene pairs, which are syntenic between both species (2,923) and whose expression is also detected in both IDC transcriptomes. The PCC distribution is calculated based on the IDC transcriptome of the P. vivax smru1 isolate and the P. falciparum HB3 strain. To evaluate the timing of transcription, the mRNA expression ratios were log2 transformed, and each expression profile was mean centered. PCCs were calculated based on the visual inspections of the corresponding expression profiles, and we defined arbitrary PCCs thresholds that divide the genes according to their conservation of expression profiles between the P. vivax and P. falciparum IDC. High correlations (PCC 1 to 0.5) include genes with highly conserved IDC expression profiles, low-to-no correlations (PCC 0.5 to −0.2) include genes with a partial shift in their the IDC expression profile, and negative correlations (PCC −0.2 to −1) include genes with a dramatic change in their IDC expression profiles in P. vivax compared with P. falciparum. (B) Examples of the corresponding gene expression profiles for genes with highly conserved expression profiles (dihydrofolate reductase-thymidilate kinase, DHFR-TS, and MSP1), genes with partial shifts in their expression profiles (MSP8 and plasmepsin IV), and genes with a dramatic change of their IDC expression profiles in P. vivax compared with P. falciparum (KAHRP and lactate/malate dehydrogenase). In the plots, the expression values are log2 transformed, and the expression profiles are mean centered. The expression profiles of the P. falciparum genes are represented by raw data (blue circles) and smoothed lines using Loess smoothing method with 3 polynomial degree 3 (blue line) whereas P. vivax expression is represented by raw values only (red circles).
Fig. 3.
Fig. 3.
Chromosomal projection of P. vivax–P. falciparum IDC transcriptome correlations. Pearson correlation values for IDC transcriptional profiles were plotted along the P. falciparum chromosomes for all 2,426 P. vivax–P. falciparum positionally conserved gene pairs. All 14 P. falciparum chromosomes are represented by blocks corresponding in size to the size to the individual chromosome. The colored sections correspond to P. vivax syntenic blocks that are projected onto the corresponding regions of the P. falciparum chromosomes. The P. vivax chromosomal origin is indicated for each synteny block (e.g., PV2 – P. vivax chromosome 2). Pearson correlations are proportionally represented by the gray bars above (positive values) or below (negative values) for all 2,426 genes, whereas genes excluded from the analysis are represented by black lines within the chromosome projection boxes. The position of each line reflects a relative location of each gene within the P. falciparum chromosomes. * represents the two regions with the highest proportion of genes with conserved IDC transcriptional regulation: number of expressed genes/number of highly (PCC > 0.5) correlated genes; ** represents the region with the lowest level of IDC correlation: number of expressed genes/number of negatively correlated (PCC < −0.2) genes.
Fig. 4.
Fig. 4.
Variability of gene expression between P. vivax isolates. (A) mRNA abundance levels were compared between three P. vivax isolates by calculating the total sum of the relative mRNA abundance across the nine time point of the IDC transcriptomes: A = ΣexpTPi, where expTP is the expression ratios measured at each time point i (1 through 9). The heat map represents the log2 transformed mean centered A values for the 249 differentially expressed genes (P value > 0.05) (see Materials and Methods). A total of 130, 85, and 34 genes exhibited increased expression levels in the smru1, smru2, and smru3 isolates, respectively. (B) Representative examples of transcriptional profiles of the deferentially expressed genes including a member of the vir family, rbp 2c, Pvstp1, cathepsin C (high expression in smru1), cyclin dependent kinase 7 (cdk7), hexokinase, and members of the RAD, pvtrag (smru2), and PHIST (smru3) families. The expression profiles represent the gene expression ratios measured by the microarray analyses against the RNA reference pool assembled from the RNA samples from all time points of the three isolates.

Similar articles

Cited by

References

    1. Mendis K, Sina BJ, Marchesini P, Carter R. The neglected burden of Plasmodium vivax malaria. Am J Trop Med Hyg. 2001;64:97–106. - PubMed
    1. Price RN, et al. Vivax malaria: Neglected and not benign. Am J Trop Med Hyg. 2007;77:79–87. - PMC - PubMed
    1. Hay SI, et al. The global distribution and population at risk of malaria: Past, present, and future. Lancet Infect Dis. 2004;4:327–336. - PMC - PubMed
    1. Krotoski WA, et al. Observations on early and late post-sporozoite tissue stages in primate malaria. IV. Pre-erythrocytic schizonts and/or hypnozoites of Chesson and North Korean strains of Plasmodium vivax in the chimpanzee. Am J Trop Med Hyg. 1986;35:263–274. - PubMed
    1. Gardner MJ, et al. Genome sequence of the human malaria parasite Plasmodium falciparum. Nature. 2002;419:498–511. - PMC - PubMed

Publication types

MeSH terms