

Review
doi: 10.1038/nrg2468.
Metabolic syndrome: from epidemiology to systems biology
Affiliations
- PMID: 18852695
- PMCID: PMC2829312
- DOI: 10.1038/nrg2468
Item in Clipboard
Review
Metabolic syndrome: from epidemiology to systems biology
Nat Rev Genet.
2008 Nov.
Abstract
Metabolic syndrome (MetSyn) is a group of metabolic conditions that occur together and promote the development of cardiovascular disease (CVD) and diabetes. Recent genome-wide association studies have identified several novel susceptibility genes for MetSyn traits, and studies in rodent models have provided important molecular insights. However, as yet, only a small fraction of the genetic component is known. Systems-based approaches that integrate genomic, molecular and physiological data are complementing traditional genetic and biochemical approaches to more fully address the complexity of MetSyn.
Figures
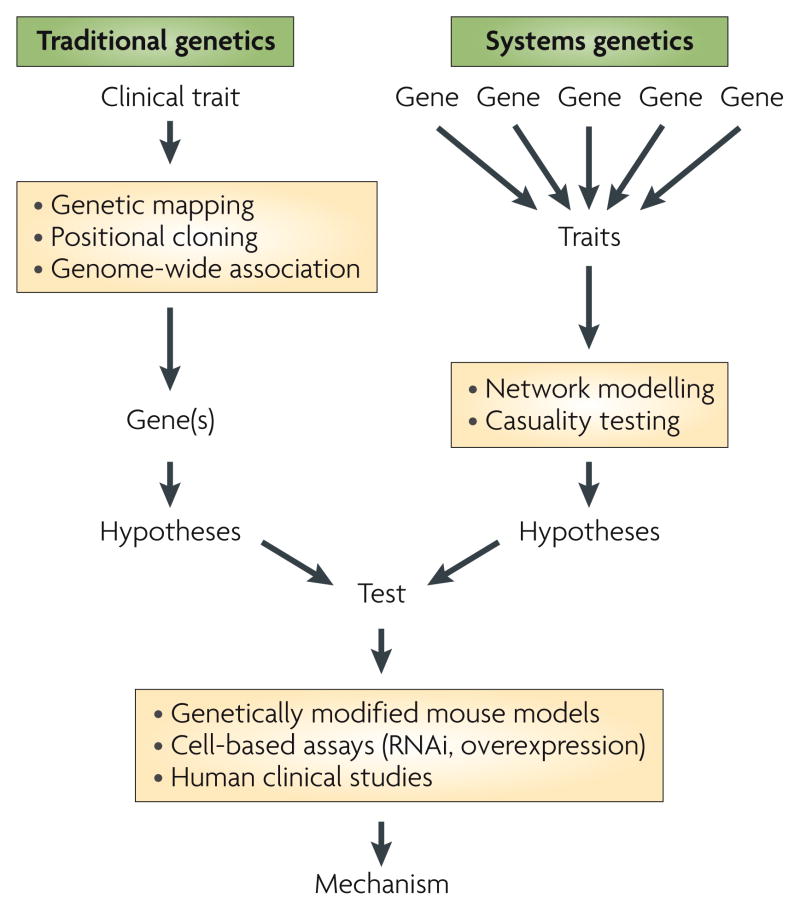
Traditional methods for the genetic analysis of metabolic syndrome (MetSyn) (left) include identification of genetic variations and mutations underlying single-gene disorders with large effects on metabolic traits through genetic mapping and positional cloning, or, more recently, genome-wide association studies in which polymorphisms in specific genes are statistically linked with clinical traits of interest in large human cohorts. Systems approaches (right) are being adopted to allow the identification of contributions of small effects from genetic variations in many genes on traits, including levels of mRNA transcripts, proteins and metabolites, as well as clinical traits. The systems approach allows the generation of network models that suggest functional interactions between genes within the network. Genes identified with both approaches can be used to formulate hypotheses, and the corresponding mechanisms can be tested through the generation of genetically engineered mouse models, through the manipulation of gene expression levels in cell-based assays using RNAi or overexpression technologies, and through human clinical studies.
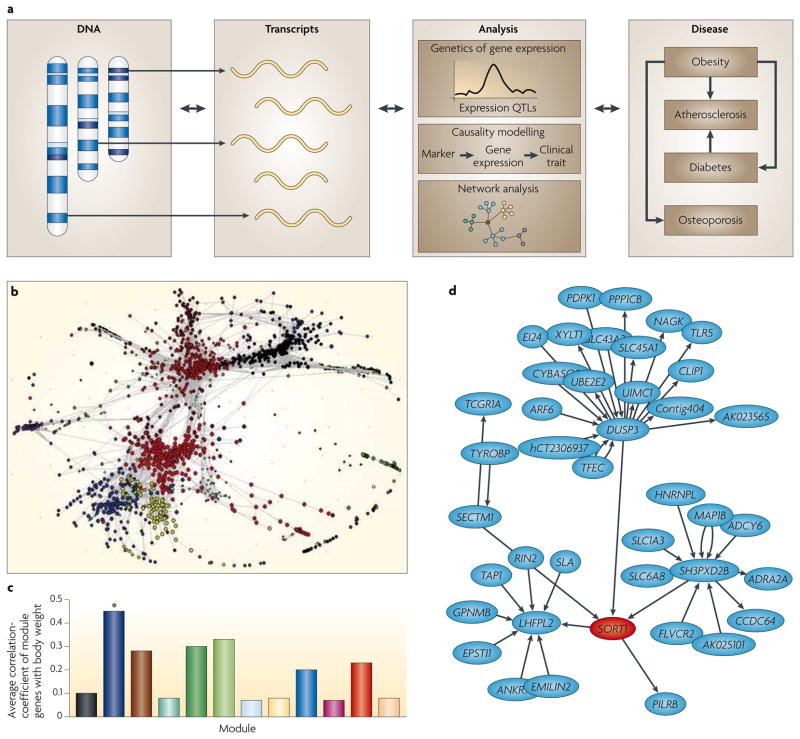
a | The examination of molecular phenotypes, such as transcript levels, in genetically randomized mouse or human populations is a powerful strategy to identify molecular networks underlying complex traits. For example, genetic variations perturb both the molecular phenotypes (transcript levels) and clinical traits. Loci controlling transcript levels (termed expression QTLs, eQTLs) can be mapped and used to prioritize positional candidates. Genes that vary together when subjected to multiple genetic perturbations are likely to share regulatory pathways, and the relationships thus obtained often closely parallel known biology, and have in some cases been validated by experimental perturbations (for example, REFS 83, 107, 111). b | A co-expression network of about 3,000 genes constructed from liver gene expression patterns of a segregating population of mice identifies modules of highly correlated genes, which are indicated by the different colours. As some modules are highly correlated with clinical traits, they can explain much more of the total variation than any individual locus. Although it is possible that modules are due to the perturbing effects of the clinical traits themselves, this is unlikely because there is little overlap between the loci controlling the clinical traits and the loci perturbing the module genes. c | Correlations of the individual colour-coded liver modules from part b (correlations averaged over their genes) and body weight. Strong correlation of particular network modules (for example, the module marked with an asterisk) with clinical traits provides a means of identifying new disease pathways. Although co-expression networks do not indicate the direction of interaction between nodes, causal modelling can be performed as discussed in BOX 5 to create ‘directed networks’. d | Sub-section of predicted causal interactions involving sortilin 1 (SORT1) and other genes in the liver. Part d is reproduced from REF. .
References
-
- Reaven GM. Banting lecture 1988. Role of insulin resistance in human disease. Diabetes. 1988;37:1595–1607. The first definition of MetSyn as an entity, defined by the clustering of abnormalities having insulin resistance as an underlying cause. Although the specific definition continues to evolve, the major insights presented here have remained important. - PubMed
-
- Eckel RH, Grundy SM, Zimmet PZ. The metabolic syndrome. Lancet. 2005;365:1415–1428. - PubMed
-
- Kahn SE, Hull RL, Utzschneider KM. Mechanisms linking obesity to insulin resistance and type 2 diabetes. Nature. 2006;444:840–846. - PubMed
-
- King RA, Rotter JI, Motulsky AG. The Genetic Basis of Common Disease. Oxford University Press; New York: 2002.
-
- Lazar MA. How obesity causes diabetes: not a tall tale. Science. 2005;307:373–375. - PubMed
Publication types
MeSH terms
Grants and funding
LinkOut - more resources
Full Text Sources
Medical
