Improved genome assembly and evidence-based global gene model set for the chordate Ciona intestinalis: new insight into intron and operon populations
- PMID: 18854010
- PMCID: PMC2760879
- DOI: 10.1186/gb-2008-9-10-r152
Improved genome assembly and evidence-based global gene model set for the chordate Ciona intestinalis: new insight into intron and operon populations
Abstract
Background: The draft genome sequence of the ascidian Ciona intestinalis, along with associated gene models, has been a valuable research resource. However, recently accumulated expressed sequence tag (EST)/cDNA data have revealed numerous inconsistencies with the gene models due in part to intrinsic limitations in gene prediction programs and in part to the fragmented nature of the assembly.
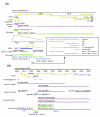
Results: We have prepared a less-fragmented assembly on the basis of scaffold-joining guided by paired-end EST and bacterial artificial chromosome (BAC) sequences, and BAC chromosomal in situ hybridization data. The new assembly (115.2 Mb) is similar in length to the initial assembly (116.7 Mb) but contains 1,272 (approximately 50%) fewer scaffolds. The largest scaffold in the new assembly incorporates 95 initial-assembly scaffolds. In conjunction with the new assembly, we have prepared a greatly improved global gene model set strictly correlated with the extensive currently available EST data. The total gene number (15,254) is similar to that of the initial set (15,582), but the new set includes 3,330 models at genomic sites where none were present in the initial set, and 1,779 models that represent fusions of multiple previously incomplete models. In approximately half, 5'-ends were precisely mapped using 5'-full-length ESTs, an important refinement even in otherwise unchanged models.
Conclusion: Using these new resources, we identify a population of non-canonical (non-GT-AG) introns and also find that approximately 20% of Ciona genes reside in operons and that operons contain a high proportion of single-exon genes. Thus, the present dataset provides an opportunity to analyze the Ciona genome much more precisely than ever.
Figures


Similar articles
-
Computational analysis of Ciona intestinalis operons.Integr Comp Biol. 2010 Jul;50(1):75-85. doi: 10.1093/icb/icq040. Epub 2010 May 11. Integr Comp Biol. 2010. PMID: 21558189
-
A cDNA resource from the basal chordate Ciona intestinalis.Genesis. 2002 Aug;33(4):153-4. doi: 10.1002/gene.10119. Genesis. 2002. PMID: 12203911
-
Genomic overview of mRNA 5'-leader trans-splicing in the ascidian Ciona intestinalis.Nucleic Acids Res. 2006 Jul 5;34(11):3378-88. doi: 10.1093/nar/gkl418. Print 2006. Nucleic Acids Res. 2006. PMID: 16822859 Free PMC article.
-
Unraveling genomic regulatory networks in the simple chordate, Ciona intestinalis.Genome Res. 2005 Dec;15(12):1668-74. doi: 10.1101/gr.3768905. Genome Res. 2005. PMID: 16339364 Review.
-
Initial stage of genetic mapping in Ciona intestinalis.Dev Dyn. 2007 Jul;236(7):1768-81. doi: 10.1002/dvdy.21163. Dev Dyn. 2007. PMID: 17471502 Review.
Cited by
-
A change in cis-regulatory logic underlying obligate versus facultative muscle multinucleation in chordates.Development. 2024 Oct 15;151(20):dev202968. doi: 10.1242/dev.202968. Epub 2024 Sep 3. Development. 2024. PMID: 39114943 Free PMC article.
-
A digital twin reproducing gene regulatory network dynamics of early Ciona embryos indicates robust buffers in the network.PLoS Genet. 2023 Sep 27;19(9):e1010953. doi: 10.1371/journal.pgen.1010953. eCollection 2023 Sep. PLoS Genet. 2023. PMID: 37756274 Free PMC article.
-
Study of Cis-regulatory Elements in the Ascidian Ciona intestinalis.Curr Genomics. 2013 Mar;14(1):56-67. doi: 10.2174/138920213804999192. Curr Genomics. 2013. PMID: 23997651 Free PMC article.
-
Origin and Diversification of Meprin Proteases.PLoS One. 2015 Aug 19;10(8):e0135924. doi: 10.1371/journal.pone.0135924. eCollection 2015. PLoS One. 2015. PMID: 26288188 Free PMC article.
-
Evaluation and rational design of guide RNAs for efficient CRISPR/Cas9-mediated mutagenesis in Ciona.Dev Biol. 2017 May 1;425(1):8-20. doi: 10.1016/j.ydbio.2017.03.003. Epub 2017 Mar 22. Dev Biol. 2017. PMID: 28341547 Free PMC article.
References
-
- Dehal P, Satou Y, Campbell RK, Chapman J, Degnan B, De Tomaso A, Davidson B, Di Gregorio A, Gelpke M, Goodstein DM, Harafuji N, Hastings KE, Ho I, Hotta K, Huang W, Kawashima T, Lemaire P, Martinez D, Meinertzhagen IA, Necula S, Nonaka M, Putnam N, Rash S, Saiga H, Satake M, Terry A, Yamada L, Wang HG, Awazu S, Azumi K, et al. The draft genome of Ciona intestinalis: insights into chordate and vertebrate origins. Science. 2002;298:2157–2167. doi: 10.1126/science.1080049. - DOI - PubMed
-
- The Ciona intestinalis Genome Browser (version 2) http://genome.jgi-psf.org/Cioin2/Cioin2.download.html
Publication types
MeSH terms
Grants and funding
LinkOut - more resources
Full Text Sources
Research Materials
Miscellaneous

