. 2008 Oct 3;135(1):49-60.
doi: 10.1016/j.cell.2008.07.032.

Global analysis of host-pathogen interactions that regulate early-stage HIV-1 replication

Affiliations

Global analysis of host-pathogen interactions that regulate early-stage HIV-1 replication

Renate König et al. Cell. .

Abstract

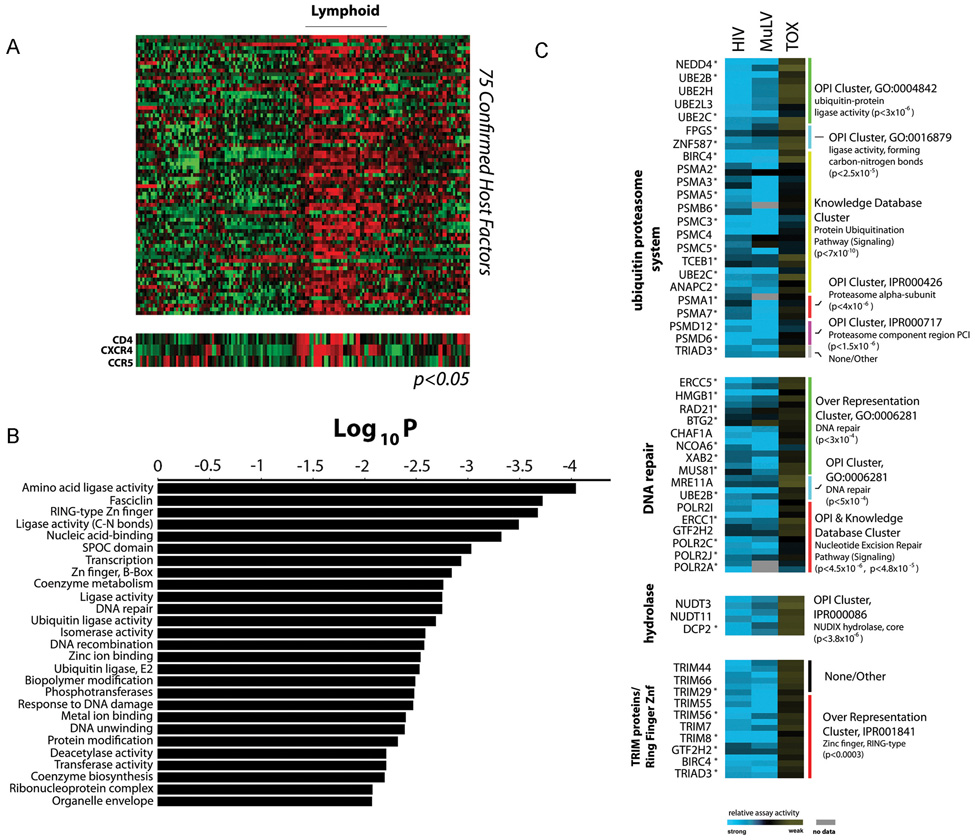
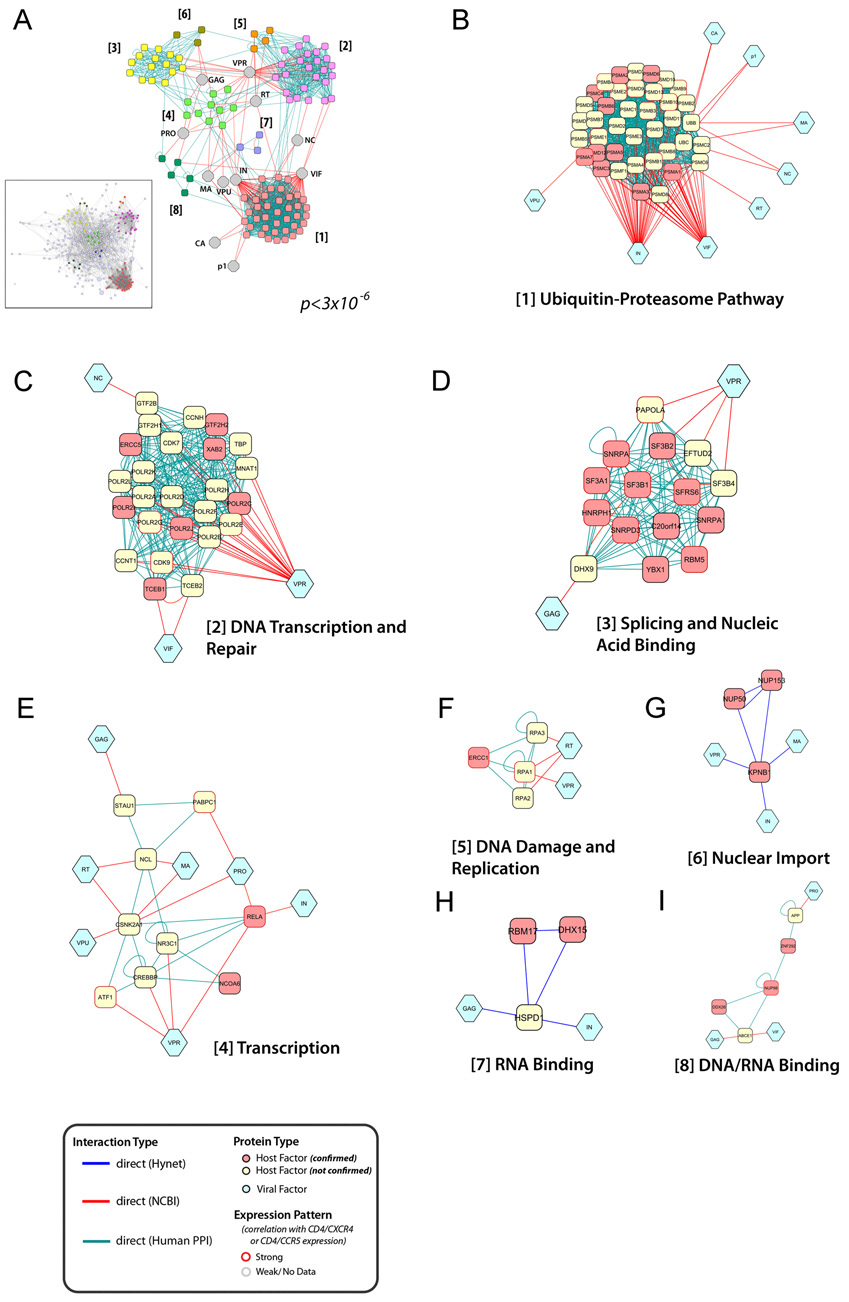
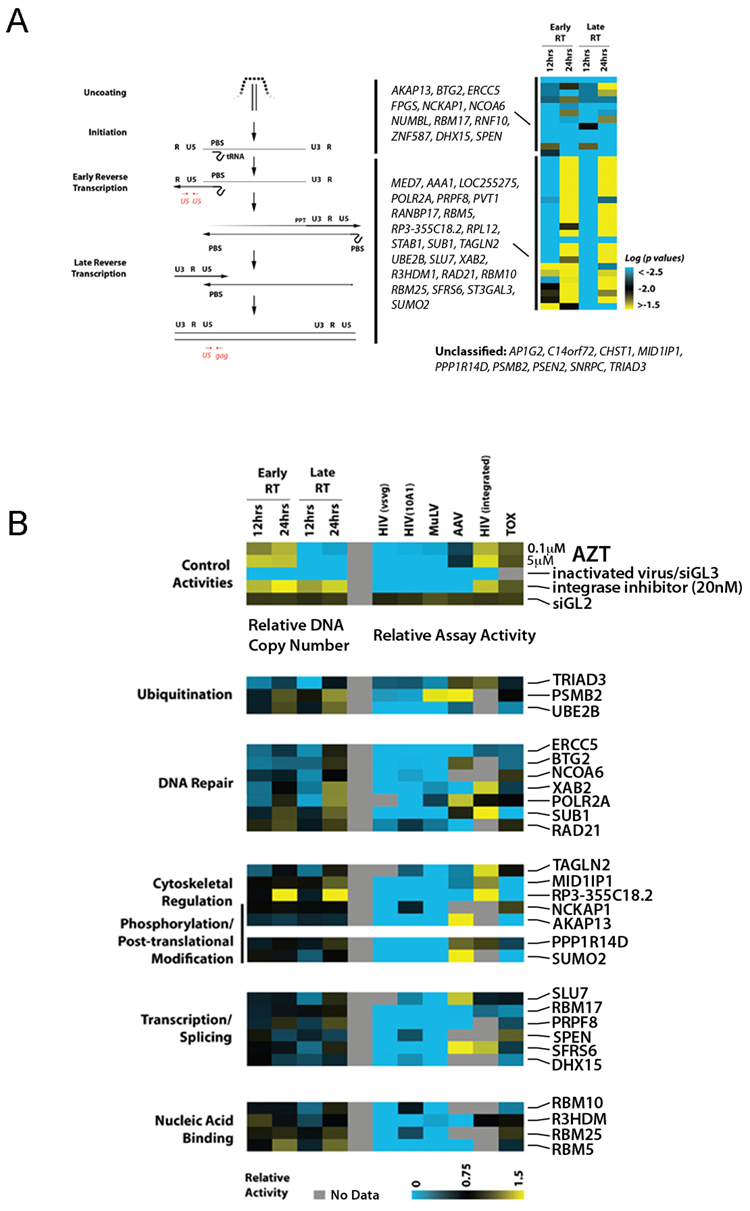
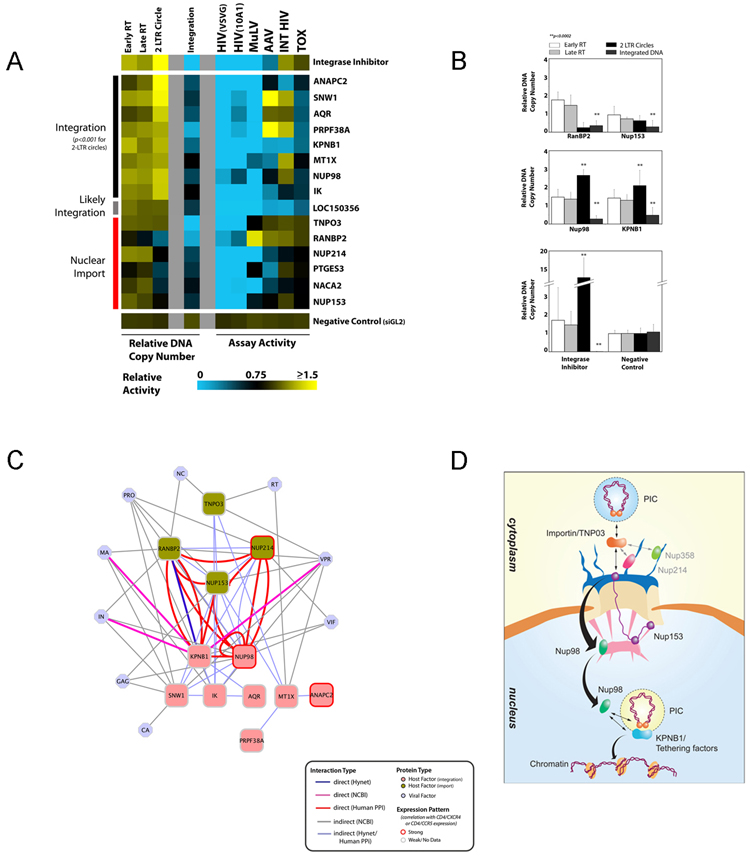
Human Immunodeficiency Viruses (HIV-1 and HIV-2) rely upon host-encoded proteins to facilitate their replication. Here, we combined genome-wide siRNA analyses with interrogation of human interactome databases to assemble a host-pathogen biochemical network containing 213 confirmed host cellular factors and 11 HIV-1-encoded proteins. Protein complexes that regulate ubiquitin conjugation, proteolysis, DNA-damage response, and RNA splicing were identified as important modulators of early-stage HIV-1 infection. Additionally, over 40 new factors were shown to specifically influence the initiation and/or kinetics of HIV-1 DNA synthesis, including cytoskeletal regulatory proteins, modulators of posttranslational modification, and nucleic acid-binding proteins. Finally, 15 proteins with diverse functional roles, including nuclear transport, prostaglandin synthesis, ubiquitination, and transcription, were found to influence nuclear import or viral DNA integration. Taken together, the multiscale approach described here has uncovered multiprotein virus-host interactions that likely act in concert to facilitate the early steps of HIV-1 infection.


Figures

Figure 1
Figure 1. Integrative analysis of HIV-host interactions
(a) To monitor early stages of HIV replication, we carried out infections using a single cycle, VSV-G pseudotyped, HIV-1 vector encoding luciferase. (b) Human 293T cells were transfected with an arrayed genome-wide siRNA library and then challenged with pNL43R+E luc [VSV-G]. Infection was monitored by measuring luciferase activity. Additionally, counterscreens were performed to identify those host factors affecting gamma retrovirus (MuLV) or parvovirus (AAV) infection, as well as cellular viability (toxicity). (c) Inhibition data for each gene was normalized, scaled, and enriched for genes which have at least 2 siRNAs supporting their activity (RSA analysis). Comparative analysis of all viral screens, after filtering for toxicity, was visualized through hierarchical clustering. (d) To facilitate the validation of biologically relevant functional and biochemical activities, we employed a multi-scale approach to select candidate genes for further study. In addition to identifying genes based on either gene (RSA) or single siRNA activity in the genome-wide assay, an ‘evidence score’ was compiled for each gene based upon a variety of other supporting criteria. Specifically, proteins, which were encompassed in statistically significant host protein interaction networks (Network 0, Network 1, MCODE), or had significant network connectivity with other putative host factors (local connectivity) or HIV encoded proteins (Direct/Indirect HIV interaction), were given additional consideration. Furthermore, genes identified through the genome-wide assay, which were members of over-represented functional groups (ontology/OPI), or had coincident expression with CD4/CXCR4 or CD4/CXCR5, were also given additional weight. The plot depicts the activities and evidence support of 295 genes for which activities were subsequently confirmed by two or more siRNAs (Table S3).
Figure 2
Figure 2. Characterization of confirmed factors required for infection by the VSV-G pseudotyped HIV-1 vector
(a) Tissue expression of 75 confirmed host cellular factors with statistically coincident expression profiles to HIV receptor/co-receptors CD4/CXCR4 or CD4/CXCR5 (p<0.05, standard χ2-Chi-square test, RCD4,CXCR4 ≥ 0.18, RCD4,CCR5 ≥ 0.13). (b) Statistically significant over-representation of functional classes and protein families based upon gene ontology (GO) and interpro (IPR) domain mapping of 295 confirmed host factors required for HIV infection (Table S4). P values were calculated by an accumulated hypergeometric distribution function (Zar, 1999) (c) Relative activities of confirmed genes, each represented by two active siRNAs, across HIV, MuLV, and cytotoxicity assays (TOX) is shown from low (blue) to high (yellow) (Table S2, Figure S4). Functional classes are derived from ontogeny-based pattern identification algorithm (OPI & Knowledge Database Clusters) or GO/IPR over-representation analysis of primary screening data. All measurements represent the mean of at least four assays, and activities not tested or unconfirmed are depicted in grey. To identify those factors most likely to influence the intracellular steps of HIV-1 replication, a subgroup of genes were further assayed and confirmed to inhibit infection by an HIV-1 vector pseudotyped with the 10A1 MuLV envelope protein, a viral envelope protein that directs pH-independent viral entry at the plasma membrane. These genes are indicated with an asterisk (*)(See also Table S3).
Figure 3
Figure 3. Network topology of HIV-host protein interactions
The interaction network was elucidated based upon protein-protein binding data derived from the Hynet yeast two-hybrid database (blue connectors) and additional various human protein interaction databases (green connectors). Furthermore, connections to HIV encoded proteins (light blue) was completed by incorporation of data from the HIV-1 Human interaction database (NIAID) (red connectors). (a, inset) The resulting network contained 2291 direct protein interactions, connecting 213 confirmed host cellular factors, 11 HIV proteins, and 169 additional human proteins, which interact directly to at least two confirmed HIV host factors and one HIV-encoded protein (Figure S6). Using permutation testing, the density of protein interactions in this network was found to be significantly enriched (p<3×10⁻⁶). (a) sTo identify potential molecular complexes, this network was analyzed for highly-connected local network modules (MCODE). (b–i) Importantly, a number of these densely-connected areas formed distinct functional subgroups, suggesting that they represent multi-protein complexes, which directly interact with viral factors to facilitate HIV replication. HIV encoded proteins were abbreviated as follows: CA: Capsid, GAG: gag polyprotein, MA: Matrix, VPR: Vpr, NC: Nucleocapsid, IN: Integrase, VIF: Vif, VPU: Vpu, RT: Reverse Transcriptase, PRO: Protease, P1: p1
Figure 4
Figure 4. Host factors important for HIV-1 Reverse Transcription
(a) 293T cells were transfected with siRNAs targeting indicated genes and, after 48h, infected with pNL43R+E-luc(VSV-G). Real-time quantitative PCR amplification analysis on DNA extracts was performed at the indicated timepoints to assess for the amount of early and late viral RT products. The left panel depicts a schematic of the reverse transcription process and the corresponding primer/probe sets utilized for the quantitative assay (red). Multiple experiments for one of more active siRNAs targeting the same gene were considered to determine statistical significance compared to negative controls (Wilcoxon signed-rank test) (right panel). A pair-wise comparison across the assays (data not shown) was also performed, and then the factors were categorized into two functional groups (indicated by the black bars). The black bars in the left panel indicate the potential steps during reverse transcription where the two separate groups of factors are proposed to act. Additional factors that influenced reverse transcription could not be statistically segregated into either of these two groups are indicated (unclassified). (b) As in panel (a), reverse transcription was monitored with 293T cells that had been transfected with siRNAs targeting indicated host mRNAs (lower panel) or with a negative control siRNA GL2 (upper panel). For control purposes, assays were also performed with the HIV-1 RT inhibitor AZT, an HIV-1 integrase inhibitor, or with heat-inactivated virus. (Top Panel). Quantitative PCR values were normalized to an internal control gene and then to the control siRNA GL2 values. The right section of the heatmap depicts the effects of the gene inhibition on various cellular assays, including infection by VSV-G or 10A1 pseudotyped HIV-1 vector, VSV-G pseudotyped MuLV vector, or by AAV, as indicated, as well on HIV-1 LTR-mediated transcription (HIV integrated) and on cellular viability (TOX) as described in Figure 1. Luciferase signal values were also normalized to control siRNA GL2. The median relative activity is depicted in a continuum of low (blue) to high (yellow). Only the genes which, upon depletion, significantly alter the initiation or rate of reverse transcription are shown (p<0.001, student t-test)
Figure 5
Figure 5. Host factors important for Nuclear Import of HIV-1 PICs and Viral DNA Integration
(a) 293T cells were transfected with siRNAs targeting indicated host factors or control siRNA (lower panel) or treated with an HIV-1 integrase inhibitor and, subsequently challenged with pNL43R+E-luc(VSV-G). Real-time quantitative PCR amplification analysis was then used to measure early and late RT products at 24 h post-infection, as well as levels of 2-LTR circles and of integrated viral DNA at 24 and 48 h post-infection, respectively. siRNA-transfected 293 cells were also subjected to the same infection, proviral expression and toxicity screens as described in figure 4b (right panel of heatmap). The median of at least three replicate experiments for one or more active siRNAs targeting the same gene is shown in a blue to yellow continuum. Genes which, when inhibited, significantly impede viral integration are shown (p<0.01, student t-test). Segregation of factors into Nuclear Import, Likely Integration, and Integration classes is primarily based on the level of 2LTR circles, and is also supported by additional statistical significance calculations based upon the collective activity across all PCR assays in comparison to positive (integrase inhibitor) and negative (siGL2) controls (Figure S7). (b) Representative single siRNA activities of nuclear envelope/import-associated genes in quantitative PCR assays reflect the dual categorization of this class of proteins in both Nuclear Import (upper panel), and integration (middle panel). Relative DNA copy numbers of early RT, late RT, 2LTR circle formation and Integrated DNA as well statistical significance for 2LTR circles and integrated DNA are shown (p<0.0001, student t-test). (c) Biochemical relationships, based upon the network analysis shown in Figure 2, between proteins involved in integration (red) and nuclear import (green) and direct or indirect interactions amongst those proteins and with proteins encoded by HIV (blue) are depicted. (d) A model for the molecular coupling nuclear import of the viral PIC and proviral DNA integration processes. Proteins were organized as predicted from the protein interaction data in 5c and oriented on the basis of the quantitative PCR data (5a and 5b).

References

    1. Arhel N, Genovesio A, Kim KA, Miko S, Perret E, Olivo-Marin JC, Shorte S, Charneau P. Quantitative four-dimensional tracking of cytoplasmic and nuclear HIV-1 complexes. Nat Methods. 2006;3:817–824. - PubMed
    1. Bader GD, Hogue CW. An automated method for finding molecular complexes in large protein interaction networks. BMC Bioinformatics. 2003;4:2. - PMC - PubMed
    1. Brass AL, Dykxhoorn DM, Benita Y, Yan N, Engelman A, Xavier RJ, Lieberman J, Elledge SJ. Identification of Host Proteins Required for HIV Infection Through a Functional Genomic Screen. Science. 2008 - PubMed
    1. Bukrinskaya A, Brichacek B, Mann A, Stevenson M. Establishment of a functional human immunodeficiency virus type 1 (HIV-1) reverse transcription complex involves the cytoskeleton. J Exp Med. 1998;188:2113–2125. - PMC - PubMed
    1. Butler SL, Hansen MS, Bushman FD. A quantitative assay for HIV DNA integration in vivo. Nat Med. 2001;7:631–634. - PubMed

Publication types