. 2009 Feb;23(2):169-75.
doi: 10.1016/j.bbi.2008.09.011. Epub 2008 Sep 27.

Behavioral recovery from acute hypoxia is reliant on leptin

Affiliations

Behavioral recovery from acute hypoxia is reliant on leptin

Christina L Sherry et al. Brain Behav Immun. 2009 Feb.

Abstract

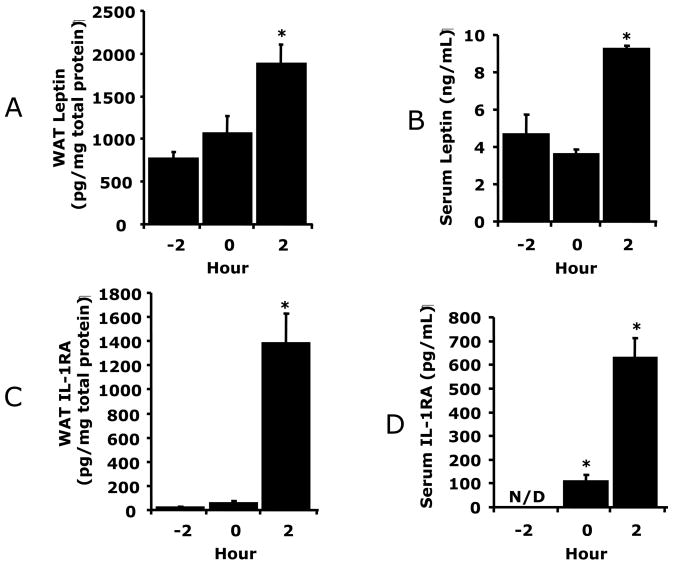
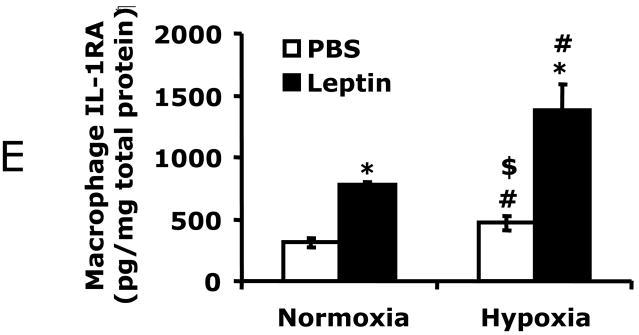
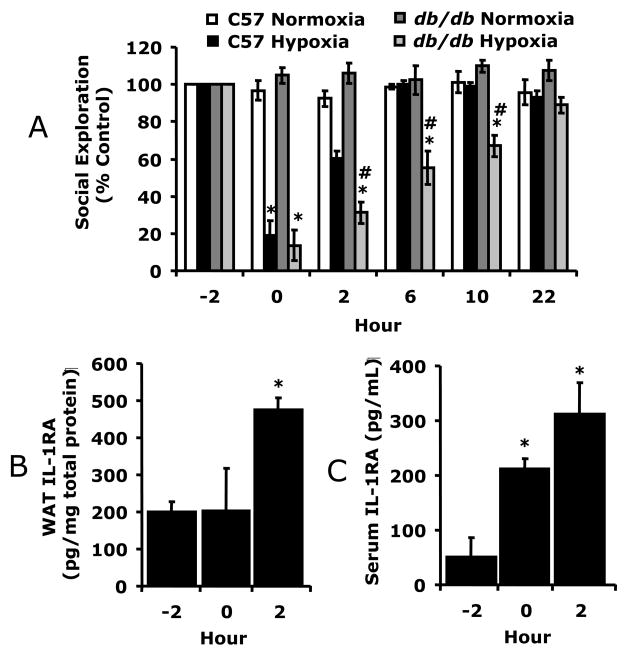
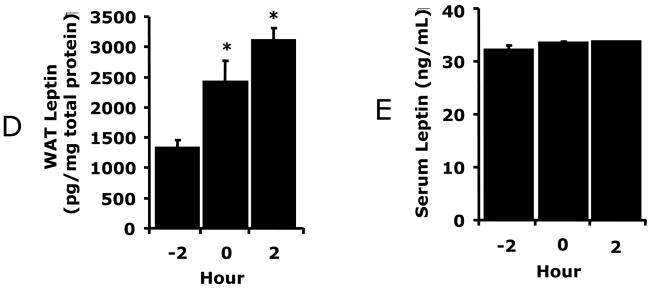
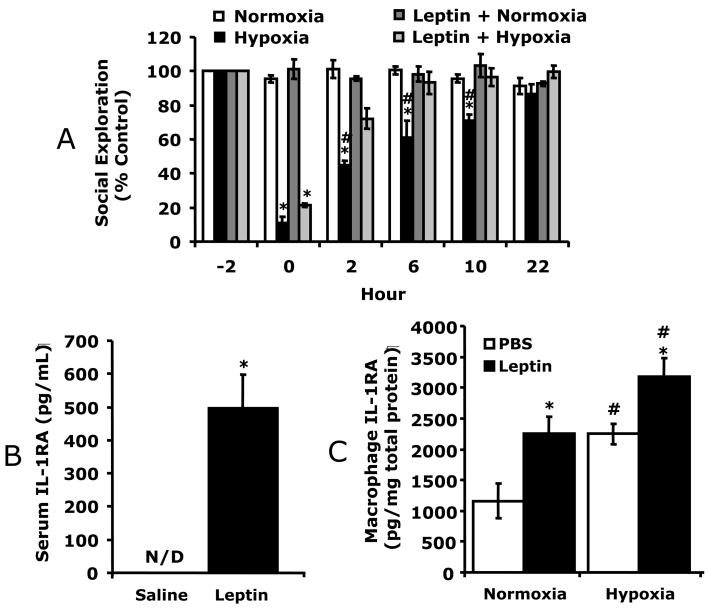
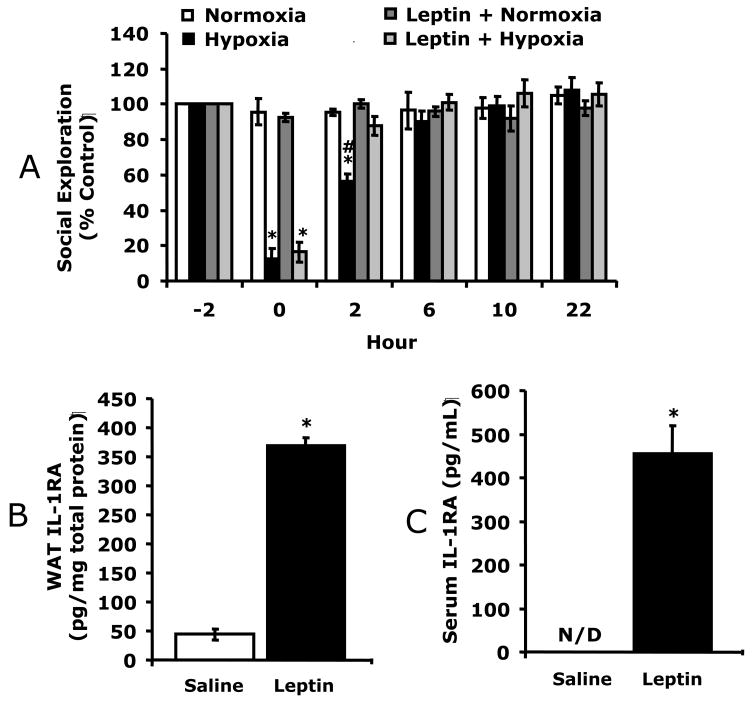
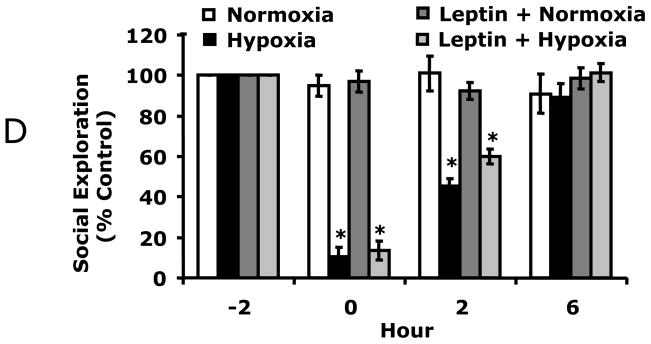
Individuals affected by hypoxia experience a variety of immune-associated sickness symptoms including malaise, fatigue, lethargy and loss of interest in the physical and social environment. Recently, we demonstrated that the interleukin (IL)-1beta arm of the neuroimmune system was critical to the sickness symptoms caused by hypoxia, and that IL-1 receptor antagonist (IL-1RA), IL-1beta's endogenous inhibitor, was critical to promoting sickness recovery. Here, we report that leptin is key to recovery from hypoxia because it dramatically augmented IL-1RA production in mice. We found that hypoxia increased leptin in white adipose tissue (WAT) which in turn, caused a marked rise in serum IL-1RA. Interestingly, in-vitro, leptin was a more potent inducer of IL-RA, in macrophages, than hypoxia. In leptin receptor defective (db/db) and leptin deficient (ob/ob) mice, sickness recovery from hypoxia was delayed 3-fold. Importantly, in ob/ob mice, leptin administration completely reversed this delayed recovery and induced a marked increase in serum IL-1RA. Finally, leptin administration to normal mice reduced hypoxia recovery time by 1/3 and dramatically increased WAT and serum IL-1RA. Leptin did not alter recovery from hypoxia in IL-1RA knock out mice. These results show that by enhancing IL-1RA production leptin promoted sickness recovery from hypoxia.


Figures

Fig. 1
Fig. 1
A/C, WAT was collected from hypoxic exposed C57BL/6J mice at the times indicated (−2 h = prior to hypoxia, 0 = immediately post hypoxia, 2 h = 2 h post hypoxia). Leptin (A) and IL-1RA (C) were measured in WAT tissue homogenates by ELISA. B/D, C57BL/6J mice were treated as in A/C and serum collected. Leptin (B) and IL-1RA (D) were measured by ELISA. Results are expressed as means ± SEM; n = 4/time point; *p < 0.05 vs −2 h. E, Macrophages were treated with or without leptin (620 nM) and/or normoxia or hypoxia for 2 h as indicated. Results are expressed as means ± SEM; n = 4; *p < 0.05 leptin vs phosphate buffered saline (PBS) (normoxia and hypoxia), # p < 0.05 normoxia vs hypoxia (PBS and leptin.), $ p <0.05 leptin normoxia vs PBS hypoxia.
Fig. 1
Fig. 1
A/C, WAT was collected from hypoxic exposed C57BL/6J mice at the times indicated (−2 h = prior to hypoxia, 0 = immediately post hypoxia, 2 h = 2 h post hypoxia). Leptin (A) and IL-1RA (C) were measured in WAT tissue homogenates by ELISA. B/D, C57BL/6J mice were treated as in A/C and serum collected. Leptin (B) and IL-1RA (D) were measured by ELISA. Results are expressed as means ± SEM; n = 4/time point; *p < 0.05 vs −2 h. E, Macrophages were treated with or without leptin (620 nM) and/or normoxia or hypoxia for 2 h as indicated. Results are expressed as means ± SEM; n = 4; *p < 0.05 leptin vs phosphate buffered saline (PBS) (normoxia and hypoxia), # p < 0.05 normoxia vs hypoxia (PBS and leptin.), $ p <0.05 leptin normoxia vs PBS hypoxia.
Fig. 2
Fig. 2
A, C57BL/6J and db/db mice were exposed to normoxia or hypoxia as indicated and social withdrawal was measured prior to hypoxia (−2 h) and at 0, 2, 6, 10 and 22 h after return of animals to normoxia. Results are expressed as percentages of the baseline measurement, means ± SEM; n = 5/treatment group; *p < 0.05, main effect of hypoxia vs normoxia, #p < 0.05, phenotype effect of C57BL/6J vs db/db. B/C, Db/db mice were treated as in A and IL-1RA was measured in WAT (B) and serum (C) by ELISA. D/E, Db/db mice were treated as in A and leptin measured in WAT (D) and serum (E) by ELISA. Results are expressed as means ± SEM; n = 4/time point; *p < 0.05 versus −2.
Fig. 2
Fig. 2
A, C57BL/6J and db/db mice were exposed to normoxia or hypoxia as indicated and social withdrawal was measured prior to hypoxia (−2 h) and at 0, 2, 6, 10 and 22 h after return of animals to normoxia. Results are expressed as percentages of the baseline measurement, means ± SEM; n = 5/treatment group; *p < 0.05, main effect of hypoxia vs normoxia, #p < 0.05, phenotype effect of C57BL/6J vs db/db. B/C, Db/db mice were treated as in A and IL-1RA was measured in WAT (B) and serum (C) by ELISA. D/E, Db/db mice were treated as in A and leptin measured in WAT (D) and serum (E) by ELISA. Results are expressed as means ± SEM; n = 4/time point; *p < 0.05 versus −2.
Fig. 3
Fig. 3
A, ob/ob mice were treated with or without leptin then exposed to normoxia or hypoxia as indicated and social withdrawal was measured prior to hypoxia (−2 h) and at 0, 2, 6, 10 and 22 h after return of animals to normoxia. Results are expressed as percentages of the baseline measurement, means ± SEM; n = 5/treatment group; *p < 0.05, main effect of normoxia vs hypoxia, #p < 0.05, treatment effect of leptin + hypoxia vs hypoxia. B, Ob/ob mice were treated with leptin as in A and IL-1RA was measured in serum by ELISA. Results are expressed as means ± SEM; n = 8/treatment; *p < 0.05. C, Macrophages from ob/ob mice were treated with or without leptin (620 nM) and/or normoxia or hypoxia for 2 h as indicated. Results are expressed as means ± SEM; n = 4; *p < 0.05 leptin vs PBS (normoxia and hypoxia), # p < 0.05 normoxia vs hypoxia (PBS and leptin).
Fig. 4
Fig. 4
A, C57BL/6J were treated with or without leptin then exposed to normoxia or hypoxia as indicated and social withdrawal was measured prior to hypoxia (−2 h) and at 0, 2, and 6, 10 and 22 h after return of animals to normoxia. Results are expressed as percentages of the baseline measurement, means ± SEM; n = 5/treatment group; *p < 0.05, main effect of hypoxia vs normoxia, #p < 0.05 treatment effect of leptin + hypoxia vs hypoxia. B/C, Mice were treated with leptin as in A and IL-1RA measured in WAT (B) and serum (C) by ELISA. Results are expressed as means ± SEM; n = 8/treatment; *p < 0.05 vs leptin. D, IL-1RA knockout were treated with leptin, as in A, then exposed to normoxia or hypoxia as indicated and social withdrawal was measured prior to hypoxia (−2 h) and at 0, 2, and 6 h after return of animals to normoxia. Results are expressed as percentages of baseline measurement, means ± SEM; n = 3/treatment group; *p < 0.05, main effect of hypoxia vs normoxia.
Fig. 4
Fig. 4
A, C57BL/6J were treated with or without leptin then exposed to normoxia or hypoxia as indicated and social withdrawal was measured prior to hypoxia (−2 h) and at 0, 2, and 6, 10 and 22 h after return of animals to normoxia. Results are expressed as percentages of the baseline measurement, means ± SEM; n = 5/treatment group; *p < 0.05, main effect of hypoxia vs normoxia, #p < 0.05 treatment effect of leptin + hypoxia vs hypoxia. B/C, Mice were treated with leptin as in A and IL-1RA measured in WAT (B) and serum (C) by ELISA. Results are expressed as means ± SEM; n = 8/treatment; *p < 0.05 vs leptin. D, IL-1RA knockout were treated with leptin, as in A, then exposed to normoxia or hypoxia as indicated and social withdrawal was measured prior to hypoxia (−2 h) and at 0, 2, and 6 h after return of animals to normoxia. Results are expressed as percentages of baseline measurement, means ± SEM; n = 3/treatment group; *p < 0.05, main effect of hypoxia vs normoxia.

Comment in

Similar articles

Cited by

References

    1. Ambrosini G, Nath AK, Sierra-Honigmann MR, Flores-Riveros J. Transcriptional activation of the human leptin gene in response to hypoxia. Involvement of hypoxia-inducible factor 1. J Biol Chem. 2002;277:34601–34609. - PubMed
    1. Basnyat B, Murdoch DR. High-altitude illness. Lancet. 2003;361:1967–1974. - PubMed
    1. Basu A, Lazovic J, Krady JK, Mauger DT, Rothstein RP, Smith MB, Levison SW. Interleukin-1 and the interleukin-1 type 1 receptor are essential for the progressive neurodegeneration that ensues subsequent to a mild hypoxic/ischemic injury. J Cereb Blood Flow Metab. 2005;25:17–29. - PubMed
    1. Braunwald E. Hypoxia and Cyanosis. In: Fauci AS, Braunwald E, Kasper DL, Hauser SL, Longo DL, Jameson JK, Loscalzo JL, editors. Harrison’s Principles of Internal Medicine. McGraw Hill Medical, United States of American; 2008. pp. 230–231.
    1. Browne GW, Pitchumoni CS. Pathophysiology of pulmonary complications of acute pancreatitis. World J Gastroenterol. 2006;12:7087–7096. - PMC - PubMed

Publication types

MeSH terms