. 2008 Dec 26;283(52):36665-75.
doi: 10.1074/jbc.M807844200. Epub 2008 Oct 14.

DYRK3 dual-specificity kinase attenuates erythropoiesis during anemia

Affiliations

DYRK3 dual-specificity kinase attenuates erythropoiesis during anemia

Olga Bogacheva et al. J Biol Chem. .

Abstract

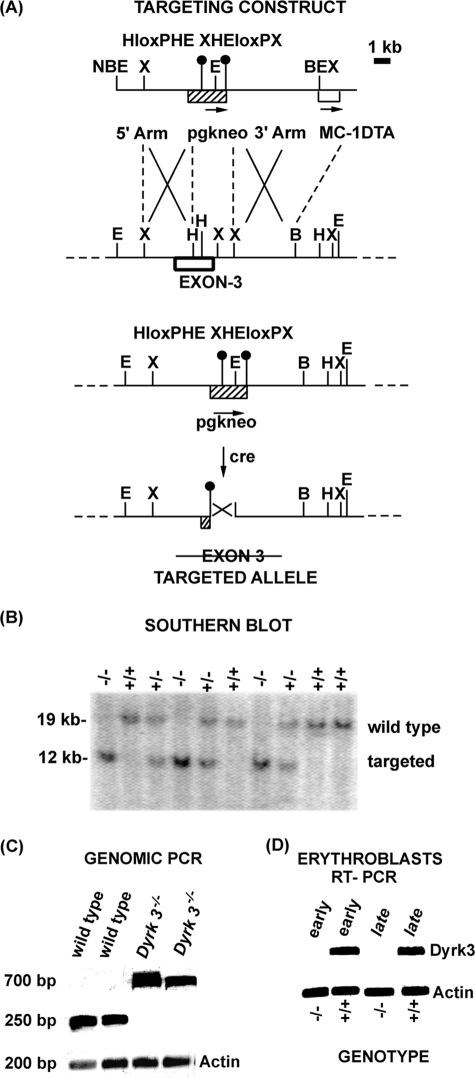
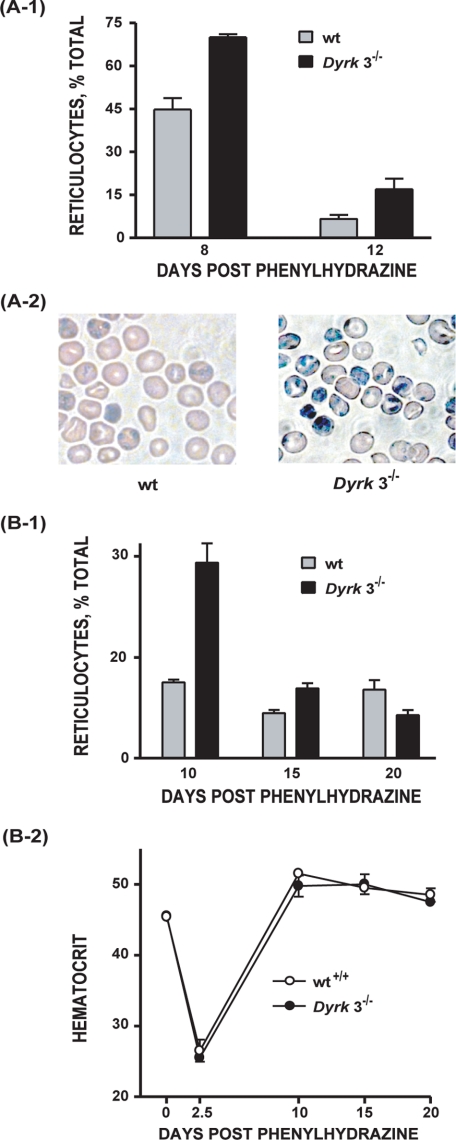
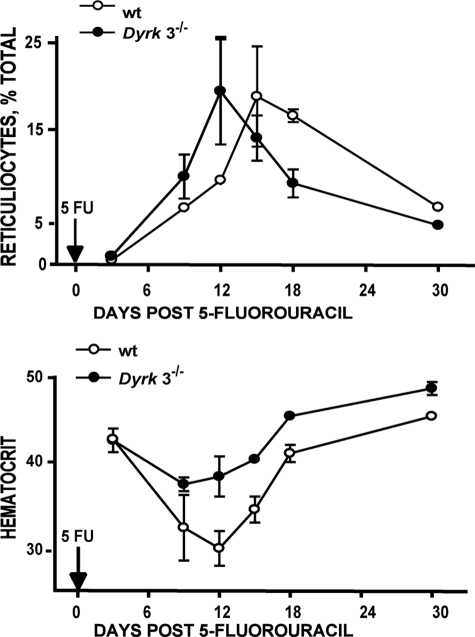
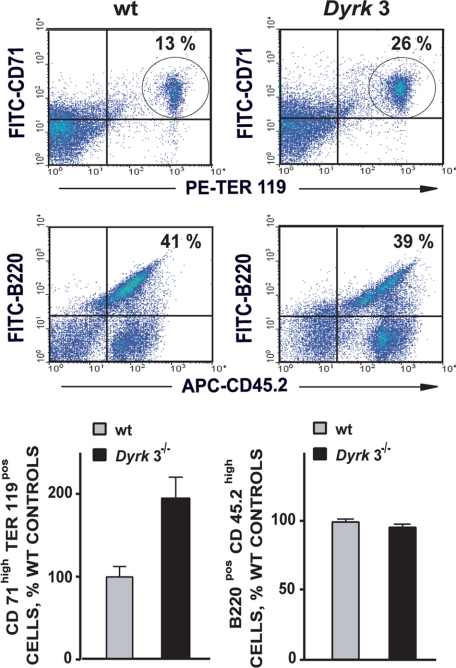
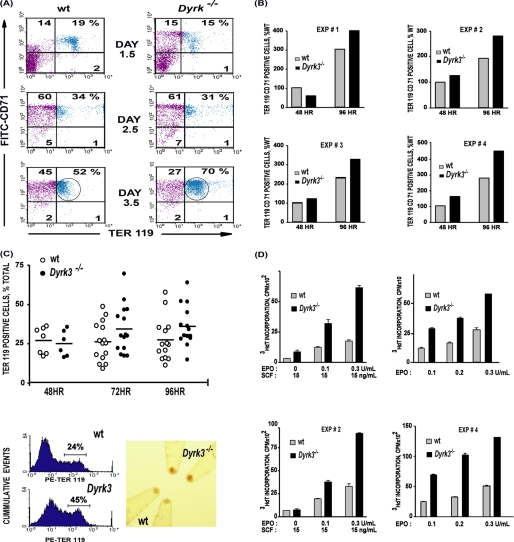
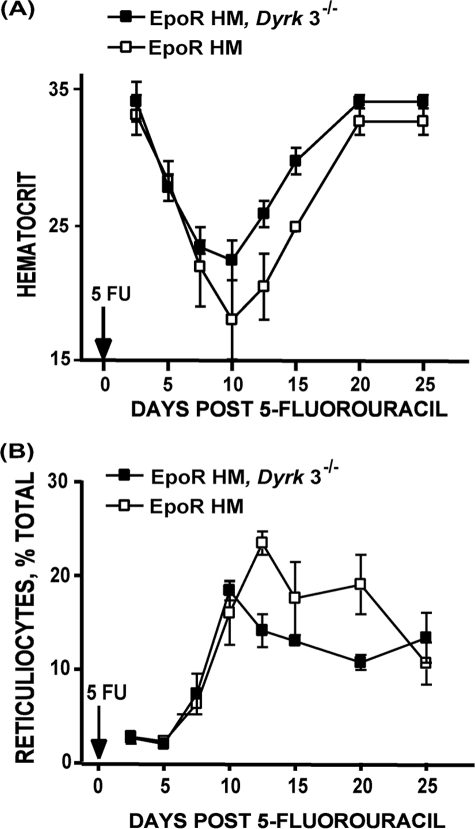
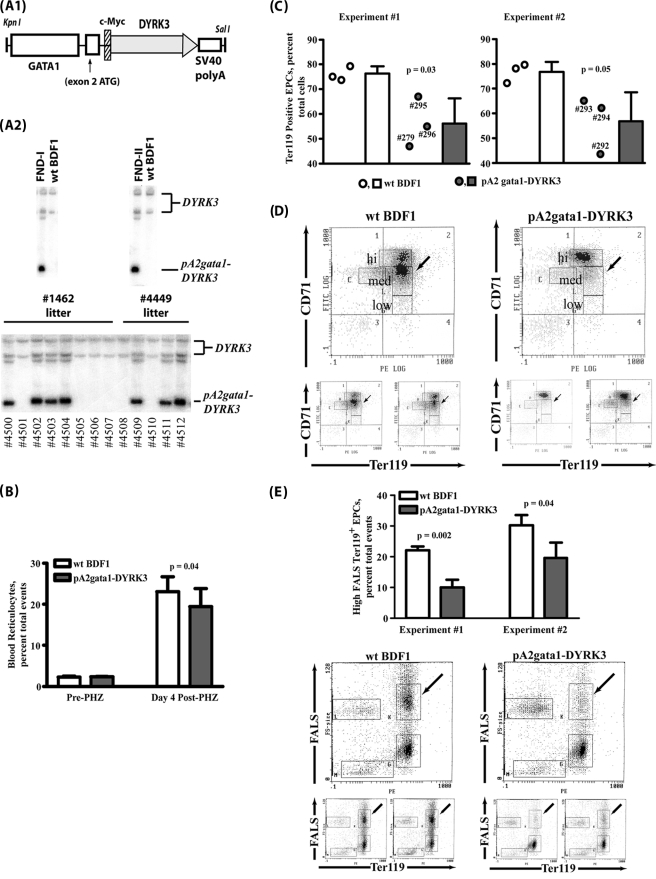
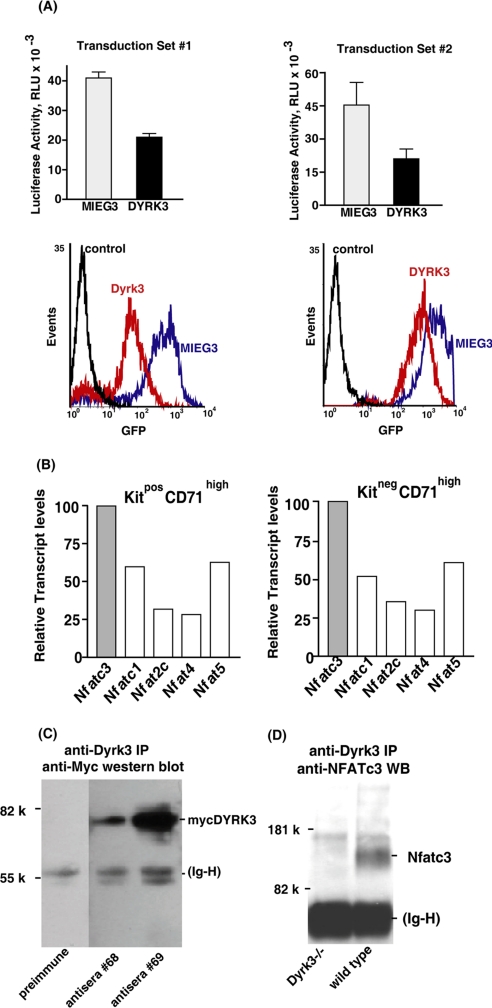
During anemia erythropoiesis is bolstered by several factors including KIT ligand, oncostatin-M, glucocorticoids, and erythropoietin. Less is understood concerning factors that limit this process. Experiments performed using dual-specificity tyrosine-regulated kinase-3 (DYRK3) knock-out and transgenic mice reveal that erythropoiesis is attenuated selectively during anemia. DYRK3 is restricted to erythroid progenitor cells and testes. DYRK3-/- mice exhibited essentially normal hematological profiles at steady state and reproduced normally. In response to hemolytic anemia, however, reticulocyte production increased severalfold due to DYRK3 deficiency. During 5-fluorouracil-induced anemia, both reticulocyte and red cell formation in DYRK3-/- mice were elevated. In short term transplant experiments, DYRK3-/- progenitors also supported enhanced erythroblast formation, and erythropoietic advantages due to DYRK3-deficiency also were observed in 5-fluorouracil-treated mice expressing a compromised erythropoietin receptor EPOR-HM allele. As analyzed ex vivo, DYRK3-/- erythroblasts exhibited enhanced CD71posTer119pos cell formation and 3HdT incorporation. Transgenic pA2gata1-DYRK3 mice, in contrast, produced fewer reticulocytes during hemolytic anemia, and pA2gata1-DYRK3 progenitors were compromised in late pro-erythroblast formation ex vivo. Finally, as studied in erythroid K562 cells, DYRK3 proved to effectively inhibit NFAT (nuclear factor of activated T cells) transcriptional response pathways and to co-immunoprecipitate with NFATc3. Findings indicate that DYRK3 attenuates (and possibly apportions) red cell production selectively during anemia.


Figures

FIGURE 1.
FIGURE 1.
Disruption of the murine DYRK3 gene. A, DYRK3 gene-targeting strategy. Targeting was with a floxed pgk-Neo cassette, which was then deleted from ES cells before blastocyst fusion. The targeted DYRK3-null allele retains a 5′-portion of exon-3 and two small upstream exons but lacks the 222 codons of exon-3 plus ∼2 kilobases (kb) of 3′-untranslated sequence (B, BamHI; E, EcoRII; H, HindIII; N, NotI; X, XbaI). B, in Southern blot analyses of DYRK3 loci, genomic DNA was digested with EcoRV and hybridized with domains external to the targeting vector. C, PCR-based DYRK3 genotyping and reverse transcription (RT)-PCR of DYRK3 transcripts in bone marrow erythroblasts after expansion in SP34-EX medium. D, early erythroblasts correspond to a KitposCD71high stage; late erythroblasts correspond to a CD71highTer119pos stage. MC-1DTA, diptheria toxin A cassette.
FIGURE 2.
FIGURE 2.
Increased reticulocyte production in DYRK3-/- mice during phenylhydrazine-induced hemolytic anemia. A, DYRK3-/- and wild-type (wt) mice were dosed with phenylhydrazine at 1 and 24 h (60 mg/kg, n = 4 mice per group). On days 8 and 12 reticulocyte levels were determined (means ± S.D.) A1, reticulocyte populations also were analyzed by methylene blue staining (A2). B, in independent experiments reticulocyte production was monitored over an extended time-course (B1). Hematocrits in phenylhydrazine-treated DYRK3-/-, and wild-type congenic controls also were determined (B2).
FIGURE 3.
FIGURE 3.
Increased reticulocyte production in DYRK3-/- mice during 5-fluorouracil induced anemia. DYRK3-/- and wild-type (wt) control mice were administered 5-fluorouracil (150 mg/kg, n = 3 mice per group). At the indicated intervals, reticulocyte levels and hematocrits were determined. For DYRK3-/- mice, note the elevated production of reticulocytes and red cells.
FIGURE 4.
FIGURE 4.
Contributions of DYRK3-deficient progenitors to the erythroid lineage are enhanced during short term repopulation. In transplantation experiments, bone marrow preparations from donor DYRK3-/- or wild-type (wt) control mice were used to repopulate irradiated Ly5.1-marked recipients. On day 13 and for mice with >90% Ly5.2 engraftment, levels of splenic CD71high Ter119pos erythroblasts were determined (in parallel with Ly5.2pos B220pos B-cells). Also graphed are mean frequencies (±S.D.) of repopulating DYRK3-/- and control CD71posTer119pos cells among n = 3 such recipients.
FIGURE 5.
FIGURE 5.
Accelerated development of DYRK3-/- erythroblasts ex vivo. A, a system was implemented in which bone marrow erythroid progenitor cells develop from CD71lowTer119neg (pro.)erythroblasts (day 1.5) to CD71highTer119neg erythroblasts (day 2.5) and further to CD71highTer119pos erythroblasts (day 3.5). In this system DYRK3-/- progenitors were observed to progress at increased frequencies to CD71highTer119pos erythroblasts (circled populations). wt, wild type. B, this above-outlined developmental advantage was observed in repeated experiments, each including pairs of DYRK3-/- and control mice (mean frequencies of CD71posTer119pos cells are graphed). C, increased Ter119pos erythroblast formation among DYRK3-/- mice. Marrow-derived progenitor cells from wild-type and DYRK3-/- mice were cultured in SP34-EX medium. At 48, 72, and 96 h, frequencies of Ter119pos erythroblasts were determined. Each symbol represents frequencies of Ter119pos erythroblasts formed in preparations from independent mice. Horizontal bars index over all mean values among groups (upper panel). A representative profile for Ter119 cell surface marker staining also is shown, and visibly detectable increases in hemoglobinization among DYRK3-/- erythroblasts (microcentrifuged cells at 96 h) also are illustrated (lower panel). D, SCF- and Epo-dependent 3HdT incorporation is increased in DYRK3-/- erythroblasts. KitposCD71high erythroblasts were isolated from expansion cultures, cultured for 20 h in the presence of SCF and/or EPO, and pulsed with 3HdT. Outcomes of four independent experiments are graphed (means ± S.E.).
FIGURE 6.
FIGURE 6.
DYRK3-/- deficiency enhances erythropoiesis during 5-fluorouracil-induced anemia in EpoR-HM mice. Mice expressing the knocked-in minimal EPO receptor allele EpoR-HM were crossed with DYRK3-/- mice to yield compound EpoR-HM:DYRK3-/- mice. In these mice and in EpoR-HM controls, anemia was induced with 5-fluorouracil (150 mg/kg). At the indicated time points, hematocrits (panel A) and reticulocyte levels (panel B) were determined (means ± S.E., n = 4).
FIGURE 7.
FIGURE 7.
pA2gata1 transgene-mediated expression of DYRK3 inhibits proerythroblast development. A, transgenic pA2gata1-DYRK3 mice construction. Panel A1, shown diagrammatically is the construct used to prepare pA2gata1-Myc-DYRK3 mice. Panel A2, pA2gata1-Myc DYRK3 founders FND-I and FND-II as analyzed via Southern blotting. Also illustrated (for FND-II) is transgene germ line transmission (lower sub-panel) (mice are identified by number, which correspond to those used in the following experiments). B, phenylhydrazine (PHZ)-induced reticulocyte production is attenuated in pA2gata1-DYRK3 mice. Phenylhydrazine (60 mg/kg) was administered at 1 and 24 h. Note the decrease in reticulocyte production among Dyrk3-/- mice (n = 5, mean ± S.D.). In this model hematocrits were not substantially affected (potentially due to compensatory events and/or stage-specific transgene effects). wt, wild type. C, frequencies of Ter119pos splenic pro-erythroblasts are decreased in pA2gata1-DYRK3 mice. At day 5 post-phenylhydrazine dosing, splenocytes were assayed for Ter119 positivity by flow cytometry. Scatter points represent individual mice. Bar graphs represent means and S.D. within each group (i.e. wild-type controls versus pA2gata1-Dyrk3 mice). Ter119-positive cell frequencies are expressed as a percentage of total splenocytes. Left panel, in experiment #1, wild type B6D2F1 splenocytes were 76.7 ± 4.1% Ter119pos, whereas pA2gata1-DYRK3 splenocytes were 56.9 ± 11.7% Ter119pos (p = 0.03). Right panel, in experiment #2, Ter119pos cell frequencies were 76.3 ± 2.9% for wild-type splenocytes versus 56.2 ± 10.2% for pA2gata1-DYRK3 splenocytes (p = 0.05). In each independent experiment, values for Ter119pos cell frequencies of pA2gata1-DYRK3 splenocytes were less than 75% that of wild-type control values. EPC, erythroid progenitor cells. D, Ter119pos erythroid progenitor cells from pA2gata1-DYRK3 mice accumulate as a CD71high subpopulation. To examine the staged-ness of Ter119pos progenitors in splenocytes from phenylhydrazine-treated DYRK3 mice, Ter119 and CD71 expression levels were co-analyzed by flow cytometry; plotted are CD71 positivity versus Ter119 positivity for wt B6D2F1 (left) and pA2gata1-DYRK3 (right) splenocyte preparations. The gated populations are Ter119pos cells expressing CD71 at high, medium, and low levels. These levels of CD71 expression previously have been shown to correlate with size and staged-ness such that earlier, larger (pro) erythroblasts express higher levels of CD71. Note the markedly attenuated development from CD71high to CD71med stages among pA2gata1-DYRK3 cells. Lower panels illustrate primary data from duplicate analyses. E, erythroid progenitors from spleens of phenylhydrazine-treated pA2gata1-DYRK3 mice form aberrantly as CD71high, but FALSlow (pro)erythroblasts. Wild-type and pA2gata1-DYRK3 mice were treated with phenylhydrazine. Erythroid splenocytes were then isolated and cultured for 18 h. Among developing (pro)erythroblasts, distributions of high versus low Ter119pos cells were analyzed. Upper panel, for two independent experiments, data defining the percentage of FALShigh Ter119pos proerythroblasts are graphed. For experiment #1, values are 22.1 ± 1.3% for wild-type B6D2F1 mice and 10.1 ± 2.5% for pA2gata1-DYRK3 mice (p = 0.002). For experiment #2, data are 30.2 ± 3.3% of wild-type B6D2F1 splenocytes and 19.6 ± 5.0% of pA2gata1-DYRK3 splenocytes are high FALS Ter119pos cells (p = 0.04). Lower panel, shown are primary flow cytometric data for FALS values versus Ter119 expression. The high FALS population (as indicated on each flow diagram with an arrow) represents a larger erythroid progenitor cell that is significantly less represented in pA2gata1-DYRK3 mice (right) versus wt B6D2F1 controls (left). Primary data shown are representative of two fully independent experiments.
FIGURE 8.
FIGURE 8.
DYRK3 represses NFAT activity in human erythroid K562 cells. A, K562-NFAT-Luc cells harboring a stably integrated single copy NFAT-luciferase reporter construct were transduced with a VSV-G packaged MIEG3 retrovirus encoding (Myc)DYRK3 (or in parallel with an empty MIEG3 vector). Stably transduced lines from two independent experiments (Set 1, Set 2) then were isolated by FACS. Effects of DYRK3 on A23187 plus phorbol 12-myristate 13-acetate-induced NFAT activity then were assessed at 4 h of induction based on NFAT luciferase reporter bioluminescence. RLU, relative luciferase units. Graphed values are the means ± S.E. (n = 4) and are representative of four independent analyses. Lower panels illustrate flow cytometry analyses of transduced and FACS-isolated K562-NFAT-Luc lines. B, NFATc3 is the predominant NFAT within primary murine bone marrow-derived erythroblasts. For marrow cell preparations from wild-type C57BL/6 mice, (pro)erythroblasts were expanded in SP34-EX medium. At day 3.5, erythroblasts at KitposCD71highTer119neg and KitnegCD71highTer119neg stages were isolated. RNA and cDNA then were prepared, and levels of transcripts were assayed by quantitative PCR for five NFAT orthologues (as indicated). At each stage, note the predominant representation of NFATc3. C and D, NFATc3 co-immunoprecipitates with endogenous DYRK3 in primary bone marrow-derived erythroblasts. Panel C illustrates the utility of a DYRK3 peptide antiserum (#69) to efficiently immunoprecipitate (IP) (Myc)DYRK3 as expressed transiently in 293 cells from a pEFNeo vector. In panel D erythroid progenitor cells were expanded in (SP34-EX medium) from bone marrow preparations from DYRK3-/- and wild-type DYRK3+/+ mice. Erythroblasts then were isolated, washed, and lysed. Lysates were subjected to immunoprecipitation using DYRK3 peptide antiserum #69. Immunoprecipitates were then assayed for the co-immunoprecipitation of NFATc3 via Western blotting (WB).

Similar articles

Cited by

References

    1. Munugalavadla, V., and Kapur, R. (2005) Crit. Rev. Oncol. Hematol. 54 63-75 - PubMed
    1. Lenox, L. E., Perry, J. M., and Paulson, R. F. (2005) Blood 105 2741-2748 - PubMed
    1. Menon, M. P., Karur, V., Bogacheva, O., Bogachev, O., Cuetara, B., and Wojchowski, D. M. (2006) J. Clin. Investig. 116 683-694 - PMC - PubMed
    1. Bauer, A., Tronche, F., Wessely, O., Kellendonk, C., Reichardt, H. M., Steinlein, P., Schutz, G., and Beug, H. (1999) Genes Dev. 13 2996-3002 - PMC - PubMed
    1. Longmore, G. D. (2006) J. Clin. Investig. 116 626-628 - PMC - PubMed

Publication types