. 2008 Oct 21;105(42):16344-9.
doi: 10.1073/pnas.0807744105. Epub 2008 Oct 14.

Efficient coding in heterogeneous neuronal populations

Affiliations

Efficient coding in heterogeneous neuronal populations

Mircea I Chelaru et al. Proc Natl Acad Sci U S A. .

Abstract

A ubiquitous feature of neuronal responses within a cortical area is their high degree of inhomogeneity. Even cells within the same functional column are known to have highly heterogeneous response properties when the same stimulus is presented. Whether the wide diversity of neuronal responses is an epiphenomenon or plays a role for cortical function is unknown. Here, we examined the relationship between the heterogeneity of neuronal responses and population coding. Contrary to our expectation, we found that the high variability of intrinsic response properties of individual cells changes the structure of neuronal correlations to improve the information encoded in the population activity. Thus, the heterogeneity of neuronal responses is in fact beneficial for sensory coding when stimuli are decoded from the population response.


Conflict of interest statement

The authors declare no conflict of interest.

Figures

Fig. 1.
Fig. 1.
Homogeneous and heterogeneous networks. (A) Homogeneous network—pooled response of LGN afferents to V1 excitatory neurons to a stimulus presented for 500 ms (averaged over 1,008 trials). Each point represents the average sum of the LGN spikes converging to a V1 neuron of preferred orientation indicated on the x axis. Neurons are ordered monotonically according to their preferred orientation. The stimulus was a vertically oriented bar of 4 deg length and 1 deg width. (B) Homogeneous network—mean V1 population responses to a stimulus oriented at 90°. Intracortical connections sharpen the weakly selective responses of the LGN afferents. (C) Homogeneous network—orientation tuning curves of six V1 neurons with preferred orientations separated by 30°. The homogeneous network had an intrinsic (small) variability due to the Poisson spike generator from LGN and the probabilistic connectivity for the thalamocortical afferents and intracortical connections. We labeled this intrinsic heterogeneity as 0% variability (or control). (D) Heterogeneous network—orientation tuning curves of the same neurons as in C. The figure shows a high degree of heterogeneity of response amplitudes and orientation tuning widths. For each neuron, the control synaptic conductances (see SI Text) were transformed into Gaussian-distributed random variables of mean equal to the control conductance, μ, and standard deviation, σ. The ratio between σ and μ represents the percent induced variability. D represents the orientation tuning curves when the induced synaptic variability was 35% (the maximum used in our study).
Fig. 2.
Fig. 2.
Changes in the neurons' response properties due to an increase in response heterogeneity. (A) Distributions of response amplitudes (the difference between the maximum and the minimum of the tuning curves in spikes per second) for homogeneous and heterogeneous networks (for different levels of synaptic variability). The variance of response amplitudes was increased by 4, 9, and 12 times for the three heterogeneous networks. (B) Distributions of the orientation selectivity index (OSI) of individual neurons for different levels of induced variability. The variance of OSIs was increased by 5, 8, and 10 times for the three heterogeneous networks. (C) Distributions of the tuning curve slopes for different levels of synaptic variability. The derivatives of the tuning curves do not vary significantly with the level of induced variability. The slopes were computed from the tuning curves of all of the neurons by presenting a stimulus at a fixed, vertical orientation. Increasing the level of synaptic variability did not change the variance of the tuning curve slopes in a pronounced manner (40.4%, −23.9%, and −7.7% changes in slope variance for the three heterogeneous networks). (D) Distributions of the absolute changes in the neurons' preferred orientation for the heterogeneous vs. homogeneous networks at different levels of synaptic variability (orientation differences are shown in bins of 0.25°). The orientation preference of neurons did not change significantly when the level of response heterogeneity was increased.
Fig. 3.
Fig. 3.
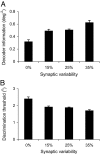
Relationship between network performance and response heterogeneity. (A) The network-orientation-discrimination performance (decoder information) increases with the degree of induced synaptic variability (P < 0.05 for each comparison at each level of synaptic variability; bootstrap method). The stimulus was decoded from the population response by using a linear decoder optimized such that information, computed as the lower limit of the FI, was maximized (see SI Text). Information was calculated for stimuli differing by 2° in orientation for 20 experimental sessions (5 sessions for each level of synaptic variability). In each session, we generated a new recurrent network that had unchanged intracortical connections but different synaptic conductances (randomly generated as described in SI Text). (B) The orientation discrimination threshold, which is inversely related to the decoder information, decreases with the increase in the induced synaptic variability (P < 0.05; bootstrap method). Error bars represent SEM.
Fig. 4.
Fig. 4.
Response heterogeneity influences the correlations between neurons. (A and B) Changes in unshuffled (A) and shuffled (B) information for the heterogeneous vs. homogeneous networks at different levels of synaptic variability. Shuffling trials, and thus removing correlations among cells, causes a decrease in information relative to the unshuffled case (P < 0.05; bootstrap method). The shuffled information is insensitive to the changes in the degree of response heterogeneity (P > 0.05; bootstrap method). For each experimental session, the information changes were computed relative to the mean over five experimental sessions (see SI Text). Error bars represent SEM. (C and D) Covariance matrices of the V1 neurons for the homogeneous (C) and heterogeneous (D) networks. In the homogeneous network (induced variability 0%), there are both positive and negative strong correlations between cells preferring a broad range of orientations. In the heterogeneous network (induced variability 35%), correlations are smaller and are limited to the cells preferring similar orientations. Each covariance matrix represents the average of the covariance matrices across five experimental sessions (see SI Text).

References

    1. Hubel D, Wiesel T. Receptive fields, binocular interaction and functional architecture in the cat's visual cortex. J Physiol. 1962;160:106–154. - PMC - PubMed
    1. Ringach DL, Shapley RM, Hawken MJ. Orientation selectivity in macaque V1: Diversity and laminar dependence. J Neurosci. 2002;22:5639–5651. - PMC - PubMed
    1. Kilgard MP, Merzenich MM. Distributed representation of spectral and temporal information in rat primary auditory cortex. Hear Res. 1999;134:16–28. - PMC - PubMed
    1. Staiger JF, et al. Functional diversity of layer IV spiny neurons in rat somatosensory cortex: Quantitative morphology of electrophysiologically characterized and biocytin labeled cells. Cereb Cortex. 2004;14:690–701. - PubMed
    1. Lee D, Port NL, Kruse W, Georgopoulos AP. Variability and correlated noise in the discharge of neurons in motor and parietal areas of the primate cortex. J Neurosci. 1988;18:1161–1170. - PMC - PubMed

Publication types

LinkOut - more resources