

Hypercapnia-induced cerebral hyperperfusion: an underrecognized clinical entity
- PMID: 18854443
- PMCID: PMC7051386
- DOI: 10.3174/ajnr.A1316
Hypercapnia-induced cerebral hyperperfusion: an underrecognized clinical entity
Abstract
Background and purpose: The incidence of cerebral hyperperfusion and hypoperfusion, respectively, resulting from hypercapnia and hypocapnia in hospitalized patients is unknown but is likely underrecognized by radiologists and clinicians without routine performance of quantitative perfusion imaging. Our purpose was to report the clinical and perfusion imaging findings in a series of patients confirmed to have hypercapnic cerebral hyperperfusion and hypocapnic hypoperfusion.
Materials and methods: Conventional cerebral MR imaging examination was supplemented with arterial spin-labeled (ASL) MR perfusion imaging in 45 patients during a 16-month period at a single institution. Patients presented with an indication of altered mental status, metastasis, or suspected stroke. Images were reviewed and correlated with arterial blood gas (ABG) analysis and clinical history.
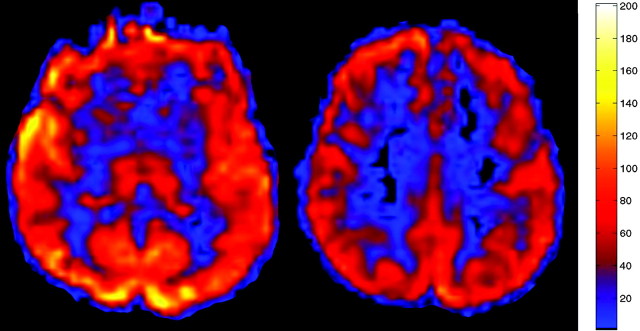
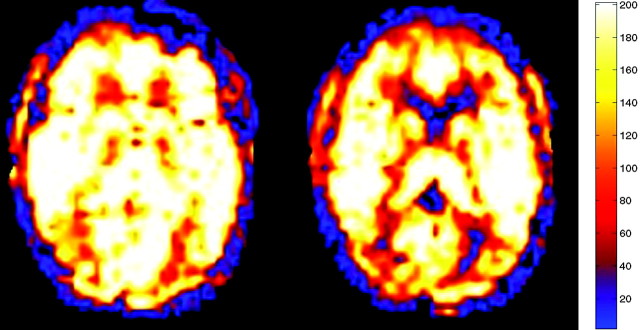
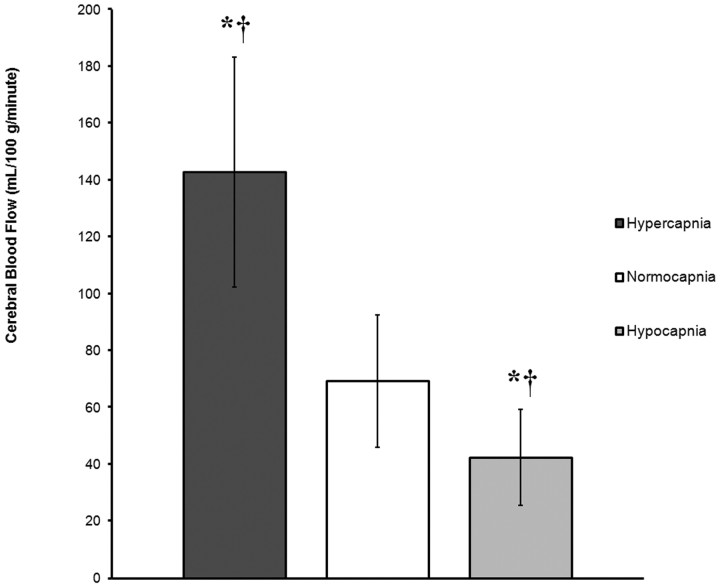
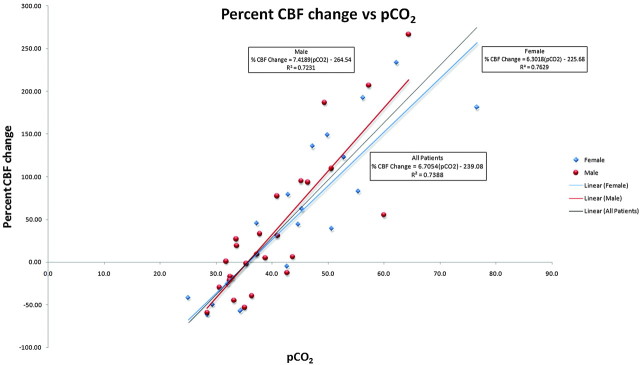
Results: Patients ranged in age from 1.5 to 85 years. No significant acute findings were identified on conventional MR imaging. Patients with hypercapnia showed global hyperperfusion on ASL cerebral blood flow (CBF) maps, respiratory acidosis on ABG, and diffuse air-space abnormalities on same-day chest radiographs. Regression analysis revealed a significant positive linear relationship between cerebral perfusion and the partial pressure of carbon dioxide (pCO(2); beta, 4.02; t, 11.03; P < .0005), such that rates of cerebral perfusion changed by 4.0 mL/100 g/min for each 1-mm Hg change in pCO(2).
Conclusions: With the inception of ASL as a routine perfusion imaging technique, hypercapnic-associated cerebral hyperperfusion will be recognized more frequently and may provide an alternative cause of unexplained neuropsychiatric symptoms in hospitalized patients. In a similar fashion, hypocapnia may account for a subset of patients with normal MR imaging examinations with poor ASL perfusion signal.
Figures

References
-
- Busija DW, Heistad DD. Factors involved in the physiological regulation of the cerebral circulation. Rev Physiol Biochem Pharmacol 1984;101:161–211 - PubMed
-
- Faraci FM, Breese KR, Heistad DD. Cerebral vasodilation during hypercapnia. Role of glibenclamide-sensitive potassium channels and nitric oxide. Stroke 1994;25:1679–83 - PubMed
-
- Madden JA. The effect of carbon dioxide on cerebral arteries. Pharmacol Ther 1993;59:229–50 - PubMed
-
- Claassen JA, Zhang R, Fu Q, et al. Transcranial Doppler estimation of cerebral blood flow and cerebrovascular conductance during modified rebreathing. J Appl Physiol 2007;102:870–77 - PubMed
-
- Vavilala MS, Lee LA, Lam AM. Cerebral blood flow and vascular physiology Anesthesiol Clin North America 2002;20:247–64 - PubMed
Publication types
MeSH terms
Substances
Grants and funding
LinkOut - more resources
Full Text Sources