. 2008:4:223.
doi: 10.1038/msb.2008.59. Epub 2008 Oct 14.

Transient transcriptional responses to stress are generated by opposing effects of mRNA production and degradation

Affiliations

Transient transcriptional responses to stress are generated by opposing effects of mRNA production and degradation

Ophir Shalem et al. Mol Syst Biol. 2008.

Abstract

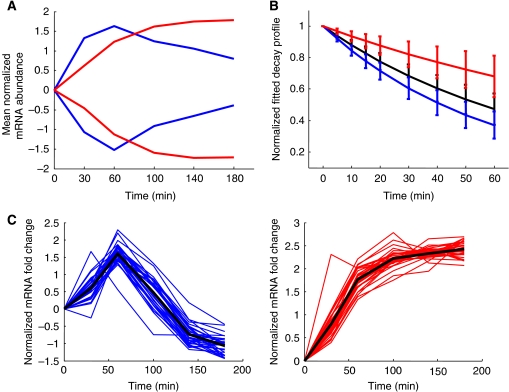
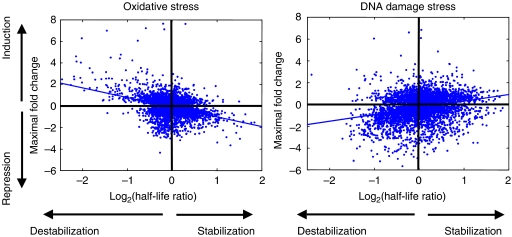
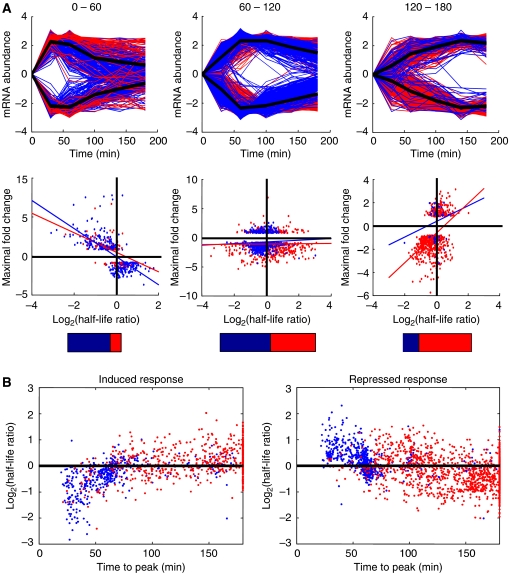
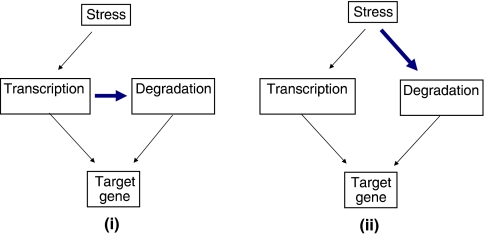
The state of the transcriptome reflects a balance between mRNA production and degradation. Yet how these two regulatory arms interact in shaping the kinetics of the transcriptome in response to environmental changes is not known. We subjected yeast to two stresses, one that induces a fast and transient response, and another that triggers a slow enduring response. We then used microarrays following transcriptional arrest to measure genome-wide decay profiles under each condition. We found condition-specific changes in mRNA decay rates and coordination between mRNA production and degradation. In the transient response, most induced genes were surprisingly destabilized, whereas repressed genes were somewhat stabilized, exhibiting counteraction between production and degradation. This strategy can reconcile high steady-state level with short response time among induced genes. In contrast, the stress that induces the slow response displays the more expected behavior, whereby most induced genes are stabilized, and repressed genes are destabilized. Our results show genome-wide interplay between mRNA production and degradation, and that alternative modes of such interplay determine the kinetics of the transcriptome in response to stress.


Conflict of interest statement

The authors declare that they have no conflict of interest.

Figures

Figure 1
Figure 1
Distinct transcriptome responses at the two conditions. (A) Mean expression profile of all induced and repressed genes (fold change >2) in oxidative and MMS stress (blue and red curves, respectively). (B) The proteasomal genes as an example for a group of genes showing coherent change in mRNA stability in response to each stress. The mean of the fitted decay profiles is shown; black, blue and red represent the reference, oxidative stress and DNA damage conditions, respectively. (C) The mRNA abundance profiles of the proteasomal genes (after mean and variance normalization) are shown for the oxidative stress and DNA damage stress (left and right panels, respectively).
Figure 2
Figure 2
Distinct relationships between the change in mRNA abundance and the change in stability between the two conditions. For each stress, the change in mRNA stability relative to the reference state (log2(t1/2 stress/t1/2 reference)) is plotted against the maximal fold change (defined as described in Materials and methods). Two different trends are observed, a negative trend (R=−0.38, p-value<3 × 10−150) for the oxidative stress and a positive trend for the DNA damage stress (R=0.27, p-value<4.2 × 10−70).
Figure 3
Figure 3
(A) Relationship between changes in mRNA abundance to changes in mRNA stability in different kinetic regimens. For both conditions, mRNA profiles are grouped according to the time point at which the maximal fold change is attained (0–60, 60–120 and 120–180 minutes). For each such group, we plot both normalized (mean and variance) mRNA abundance profiles (upper panels) and, as was done in Figure 2, the relationship between the maximal mRNA abundance fold changes to the changes in mRNA stability relative to the reference condition (lower panels). We joined in each plot profiles from the two conditions, blue and red correspond to oxidative and MMS stress, respectively. The first group of genes, which mostly consists of profiles in the oxidative stress condition, displays transient kinetics and an early peak, in the first 40 min following the stress. These genes display an opposite relationship between the changes in mRNA stability and the net change in mRNA abundance. As we progress to groups of genes that attained a later peak, the negative correlation is replaced with a positive correlation. The last group, which displays long enduring kinetics, shows a positive correlation between the changes in mRNA abundance to the change in mRNA stability. The bars below each group represent the relative amount of genes from each stress represented in each group. (B) Changes in mRNA stability determine response duration. The time at which the maximal fold change in mRNA abundance is attained against the half-life change is plotted separately for induced and repressed genes. The different colors represent the two conditions, blue and red for oxidative and DNA damage stress, respectively. Opposite trends are observed between induced and repressed genes. In addition, both conditions display similar trends with difference in the amount of genes that display transient versus endured response.
Figure 4
Figure 4
Two alternative models that might account for the observed coordination between transcription and degradation. Our results suggest coordination between changes in transcription to changes in mRNA degradation; this might be achieved by at least two alternative models: The first (i) suggests direct coupling between transcription and degradation meaning that mRNA degradation is directly affected by the rates of production. According to a possible alternative model (ii), the sensor of the stress activates a transcriptional response and, independently of that, it also induces a change in stability of the transcripts.

References

    1. Bernstein JA, Khodursky AB, Lin PH, Lin-Chao S, Cohen SN (2002) Global analysis of mRNA decay and abundance in Escherichia coli at single-gene resolution using two-color fluorescent DNA microarrays. Proc Natl Acad Sci USA 99: 9697–9702 - PMC - PubMed
    1. Fan J, Yang X, Wang W, Wood WH III, Becker KG, Gorospe M (2002) Global analysis of stress-regulated mRNA turnover by using cDNA arrays. Proc Natl Acad Sci USA 99: 10611–10616 - PMC - PubMed
    1. Foat BC, Houshmandi SS, Olivas WM, Bussemaker HJ (2005) Profiling condition-specific, genome-wide regulation of mRNA stability in yeast. Proc Natl Acad Sci USA 102: 17675–17680 - PMC - PubMed
    1. Garcia-Martinez J, Aranda A, Perez-Ortin JE (2004) Genomic run-on evaluates transcription rates for all yeast genes and identifies gene regulatory mechanisms. Mol Cell 15: 303–313 - PubMed
    1. Garneau NL, Wilusz J, Wilusz CJ (2007) The highways and byways of mRNA decay. Nat Rev Mol Cell Biol 8: 113–126 - PubMed

Publication types