. 2008:4:219.
doi: 10.1038/msb.2008.56. Epub 2008 Oct 14.

Systemic multicompartmental effects of the gut microbiome on mouse metabolic phenotypes

Affiliations

Systemic multicompartmental effects of the gut microbiome on mouse metabolic phenotypes

Sandrine P Claus et al. Mol Syst Biol. 2008.

Abstract

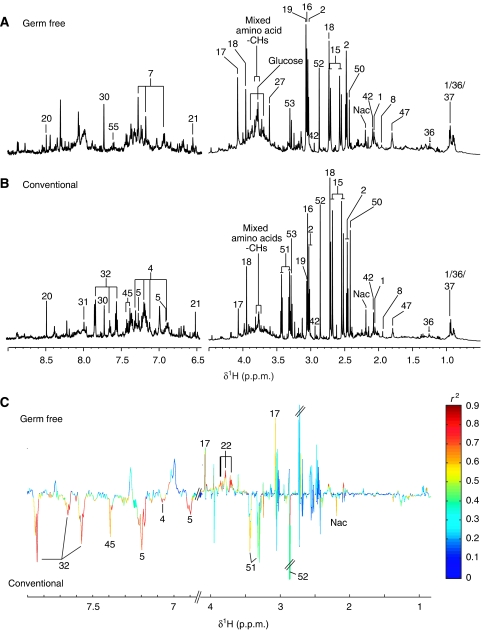
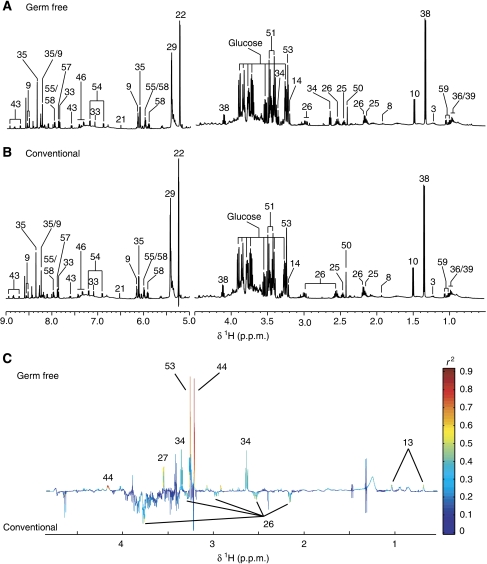
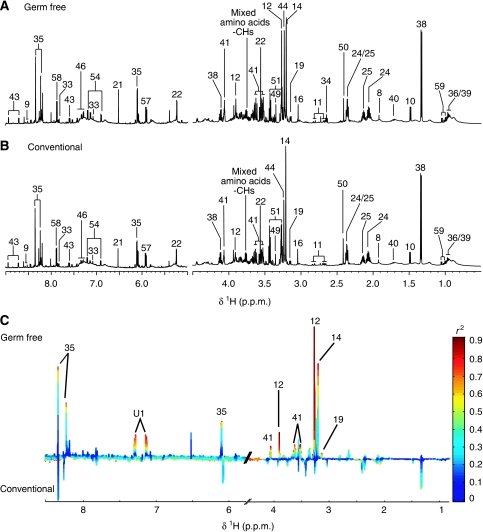
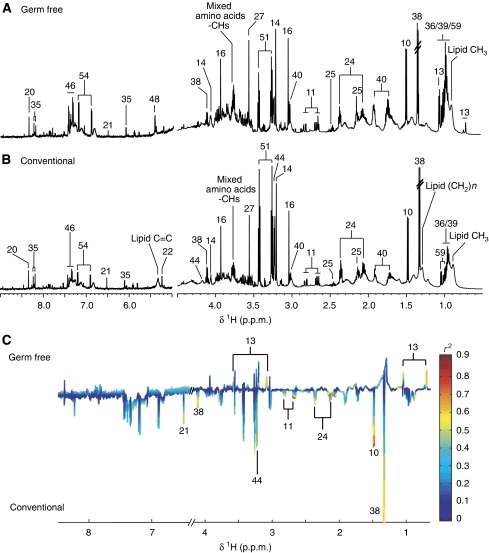
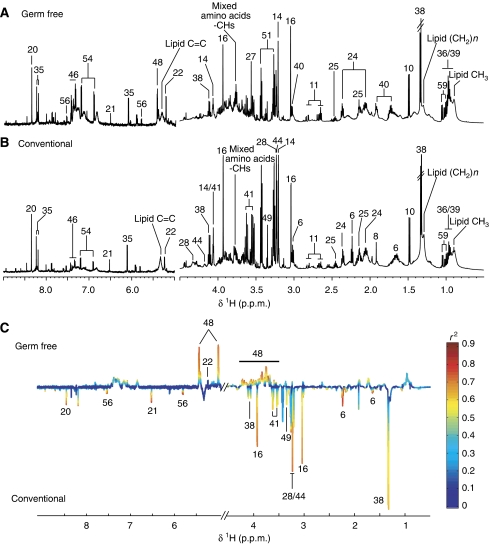
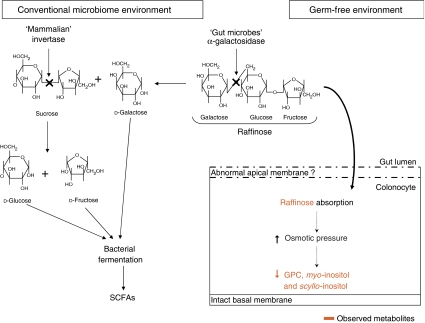
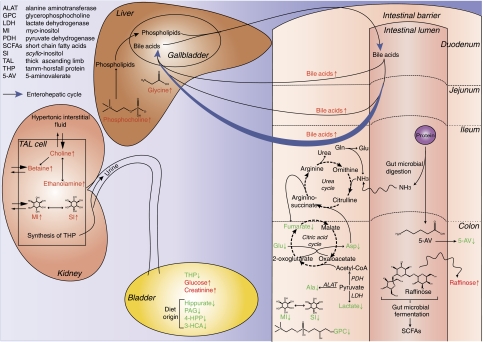
To characterize the impact of gut microbiota on host metabolism, we investigated the multicompartmental metabolic profiles of a conventional mouse strain (C3H/HeJ) (n=5) and its germ-free (GF) equivalent (n=5). We confirm that the microbiome strongly impacts on the metabolism of bile acids through the enterohepatic cycle and gut metabolism (higher levels of phosphocholine and glycine in GF liver and marked higher levels of bile acids in three gut compartments). Furthermore we demonstrate that (1) well-defined metabolic differences exist in all examined compartments between the metabotypes of GF and conventional mice: bacterial co-metabolic products such as hippurate (urine) and 5-aminovalerate (colon epithelium) were found at reduced concentrations, whereas raffinose was only detected in GF colonic profiles. (2) The microbiome also influences kidney homeostasis with elevated levels of key cell volume regulators (betaine, choline, myo-inositol and so on) observed in GF kidneys. (3) Gut microbiota modulate metabotype expression at both local (gut) and global (biofluids, kidney, liver) system levels and hence influence the responses to a variety of dietary modulation and drug exposures relevant to personalized health-care investigations.


Figures

Figure 1
Figure 1
1H NMR spectra (600 MHz) of urine samples from germ-free (GF) (A) and conventional (B) mice. The aromatic region (δ 6.5–9.0) has been vertically expanded × 4. (C) Plot of O-PLS-DA coefficients related to the discrimination between 1H NMR spectra of urine from GF (top) and conventional (bottom) mice. For identification of the peak numbers, refer to codes in Table II.
Figure 2
Figure 2
1H NMR spectra (600 MHz) of liver aqueous extracts of germ-free (GF) (A) and conventional (B) mice. The aromatic region (δ 6.5–9.0) has been vertically expanded × 4. (C) Plot of O-PLS-DA coefficients related to the discrimination between 1H NMR spectra of urine from GF (top) and conventional (bottom) mice. For identification of the peak numbers, refer to codes in Table II.
Figure 3
Figure 3
1H NMR spectra (600 MHz) of kidney aqueous extracts of germ-free (GF) (A) and conventional (B) mice. The aromatic region (δ 6.5–9.0) has been vertically expanded × 4. (C) Plot of O-PLS-DA coefficients related to the discrimination between 1H NMR spectra of urine from GF (top) and conventional (bottom) mice. For identification of the peak numbers, refer to codes in Table II.
Figure 4
Figure 4
1H NMR spectra (600 MHz) of ileum aqueous extracts of germ-free (GF) (A) and conventional (B) mice. The aromatic region (δ 6.5–9.0) has been vertically expanded × 4. (C) Plot of O-PLS-DA coefficients related to the discrimination between 1H NMR spectra of urine from GF (top) and conventional (bottom) mice. For identification of the peak numbers, refer to codes in Table II.
Figure 5
Figure 5
1H NMR spectra (600 MHz) of colon aqueous extracts of germ-free (GF) (A) and conventional (B) mice. The aromatic region (δ 6.5–9.0) has been vertically expanded × 4. (C) Plot of O-PLS-DA coefficients related to the discrimination between 1H NMR spectra of urine from GF (top) and conventional (bottom) mice. For identification of the peak numbers, refer to codes in Table II.
Figure 6
Figure 6
Variation of raffinose metabolism by colonocytes in germ-free (GF) and conventional microbiome animals. In conventional animals, raffinose is first digested by microbial α-galactosidase to release galactose and sucrose. Then, the mammalian invertase attached to the brush border releases glucose and fructose from sucrose. These monosaccharides are then utilized as a source of carbon for bacterial fermentation. In GF animals, raffinose is not catabolized and passive diffusion into colonocytes may occur contributing to the osmotic pressure that is regulated by decreasing levels of the mobile osmolytes: glycerophosphocholine, myo-inositol and scyllo-inositol. GPC, glycerophosphocholine; SCFAs, short chain fatty acids.
Figure 7
Figure 7
Summary of some of the major systemic effects of the gut microbiome on mouse metabolism in different compartments. Metabolites observed in this study are shown in red when their level is higher in GF profiles or in green when it is lower. The enterohepatic cycle of bile acids is shown as blue arrows. The citric acid cycle has been simplified for clarity.

Similar articles

Cited by

References

    1. Albrecht J, Jones EA (1999) Hepatic encephalopathy: molecular mechanisms underlying the clinical syndrome. J Neurol Sci 170: 138–146 - PubMed
    1. Alfieri R (2007) Hyperosmotic stress response: comparison with other cellular stresses. Pflugers Arch 454: 173–185 - PubMed
    1. Alvaro D, Cantafora A, Attili AF, Ginanni Corradini S, De Luca C, Minervini G, Di Biase A, Angelico M (1986) Relationships between bile salts hydrophilicity and phospholipid composition in bile of various animal species. Comp Biochem Physiol B 83: 551–554 - PubMed
    1. Amieva MR, El-Omar EM (2008) Host–bacterial interactions in Helicobacter pylori infection. Gastroenterology 134: 306–323 - PubMed
    1. Aruoma OI, Halliwell B, Hoey BM, Butler J (1988) The antioxidant action of taurine, hypotaurine and their metabolic precursors. Biochem J 256: 251–255 - PMC - PubMed

Publication types