. 2008:4:222.
doi: 10.1038/msb.2008.61. Epub 2008 Oct 14.

Selected reaction monitoring for quantitative proteomics: a tutorial

Affiliations

Selected reaction monitoring for quantitative proteomics: a tutorial

Vinzenz Lange et al. Mol Syst Biol. 2008.

Abstract

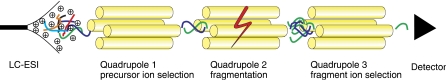
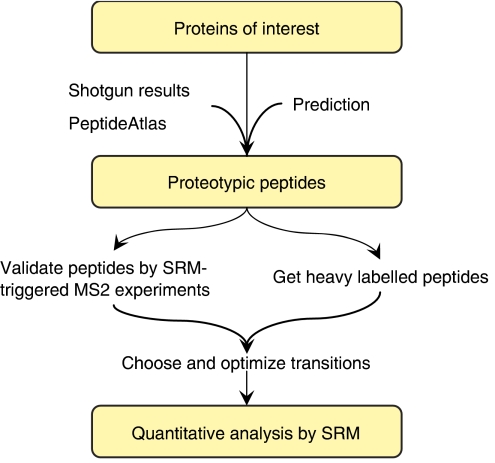
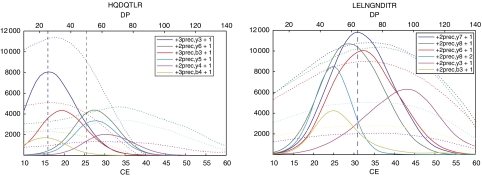
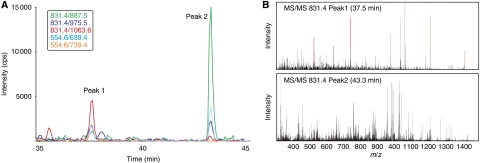
Systems biology relies on data sets in which the same group of proteins is consistently identified and precisely quantified across multiple samples, a requirement that is only partially achieved by current proteomics approaches. Selected reaction monitoring (SRM)-also called multiple reaction monitoring-is emerging as a technology that ideally complements the discovery capabilities of shotgun strategies by its unique potential for reliable quantification of analytes of low abundance in complex mixtures. In an SRM experiment, a predefined precursor ion and one of its fragments are selected by the two mass filters of a triple quadrupole instrument and monitored over time for precise quantification. A series of transitions (precursor/fragment ion pairs) in combination with the retention time of the targeted peptide can constitute a definitive assay. Typically, a large number of peptides are quantified during a single LC-MS experiment. This tutorial explains the application of SRM for quantitative proteomics, including the selection of proteotypic peptides and the optimization and validation of transitions. Furthermore, normalization and various factors affecting sensitivity and accuracy are discussed.


Conflict of interest statement

The authors declare that they have no conflict of interest.

Figures

Figure 1
Figure 1
SRM/MRM analysis on QQQ MS. Several analytes are coeluting from the chromatographic system. The specific m/z selection in the first quadrupole filters out most coeluting ions. However, owing to identical mass, one interfering ion (blue) remains. In quadrupole 2, the analytes are fragmented. The m/z selection in the third quadrupole filters out all the fragments of the blue analyte and leaves only a particular fragment of the green analyte for specific detection.
Figure 2
Figure 2
Workflow of SRM-based proteomic experiments.
Figure 3
Figure 3
Optimization of transitions. Plot of intensity versus collision energy (CE, solid lines) or declustering potential (DP, dotted lines) for the six best transitions of two peptides obtained by ramping CE and DP in constant infusion mode. The predicted CEs for the doubly (blue, CE=0.044 × m/z+5.5) and triply (green, CE=0.051 × m/z+0.5) charged precursors are marked by vertical dashed lines.
Figure 4
Figure 4
Validation of transitions. SRM-triggered MS/MS experiment for the validation of transitions for peptide VFAQFSSFVDSVIAK. (A) SRM traces of five transitions. Two peaks with co-eluting transitions are apparent at 37.5 and 43.3 min. (B) MS/MS spectra triggered at the apex of SRM peaks 1 (upper panel) and 2 (lower panel). Peaks matching the respective y ions are coloured in red. Even though at 43.3 min, SRM transition intensities are higher, the MS/MS spectra clearly show that the targeted peptide is eluting at 37.5 min. Utilizing transition intensities at 43.3 min without validation would lead to false quantification values for the targeted peptide.
Figure 5
Figure 5
Quantitative accuracy as a function of dwell time and cycle time. Quantification of a peptide using different settings for dwell time and cycle time. Reducing the dwell time from 50 to 5 ms decreases accuracy. With cycle times of 10 or 20 s, the peak height cannot be estimated correctly even though the accuracy of the individual data points is excellent at 500 ms dwell time. Changes in dwell time do not affect absolute signal intensity as it is plotted normalized as ‘counts per second'.
Figure 6
Figure 6
Validation of transitions for yeast proteins. SRM-triggered MS/MS experiment for the validation of transitions for a high- (A) and a low-abundance (B) protein of S. cerevisiae. Owing to the low abundance of protein YKL141W (B), the SRM traces for the corresponding peptide AAIAEEQILNK were of low intensity. Nevertheless, the acquired MS/MS spectrum confirmed the identity of the peptide with high confidence.
Figure 7
Figure 7
Quantification of proteins in plasma. A total of 360 transitions were acquired by scheduled SRM to quantify 60 peptides in plasma samples following glycocapture. Traces for one peptide in 1 out of 100 analysed samples are shown. On the basis of the heavy isotope-labelled peptide (dashed lines), the concentration of the endogenous protein (solid lines) was estimated to be 5 ng/ml.

References

    1. Ashburner M, Ball CA, Blake JA, Botstein D, Butler H, Cherry JM, Davis AP, Dolinski K, Dwight SS, Eppig JT, Harris MA, Hill DP, Issel-Tarver L, Kasarskis A, Lewis S, Matese JC, Richardson JE, Ringwald M, Rubin GM, Sherlock G (2000) Gene ontology: tool for the unification of biology. The Gene Ontology Consortium. Nat Genet 25: 25–29 - PMC - PubMed
    1. Barr JR, Maggio VL, Patterson DG Jr, Cooper GR, Henderson LO, Turner WE, Smith SJ, Hannon WH, Needham LL, Sampson EJ (1996) Isotope dilution–mass spectrometric quantification of specific proteins: model application with apolipoprotein A-I. Clin Chem 42: 1676–1682 - PubMed
    1. Barrett T, Troup DB, Wilhite SE, Ledoux P, Rudnev D, Evangelista C, Kim IF, Soboleva A, Tomashevsky M, Edgar R (2007) NCBI GEO: mining tens of millions of expression profiles—database and tools update. Nucl Acids Res 35: D760–D765 - PMC - PubMed
    1. Beynon RJ, Doherty MK, Pratt JM, Gaskell SJ (2005) Multiplexed absolute quantification in proteomics using artificial QCAT proteins of concatenated signature peptides. Nat Methods 2: 587–589 - PubMed
    1. Bodenmiller B, Malmstrom J, Gerrits B, Campbell D, Lam H, Schmidt A, Rinner O, Mueller LN, Shannon PT, Pedrioli PG, Panse C, Lee HK, Schlapbach R, Aebersold R (2007) PhosphoPep–a phosphoproteome resource for systems biology research in Drosophila Kc167 cells. Mol Syst Biol 3: 139 10.1038/msb4100182 - PMC - PubMed

Publication types

MeSH terms