. 2008 Dec;195(2):179-86.
doi: 10.1016/j.jmr.2008.09.015. Epub 2008 Sep 23.

Biomolecular solid state NMR with magic-angle spinning at 25K

Affiliations

Biomolecular solid state NMR with magic-angle spinning at 25K

Kent R Thurber et al. J Magn Reson. 2008 Dec.

Abstract

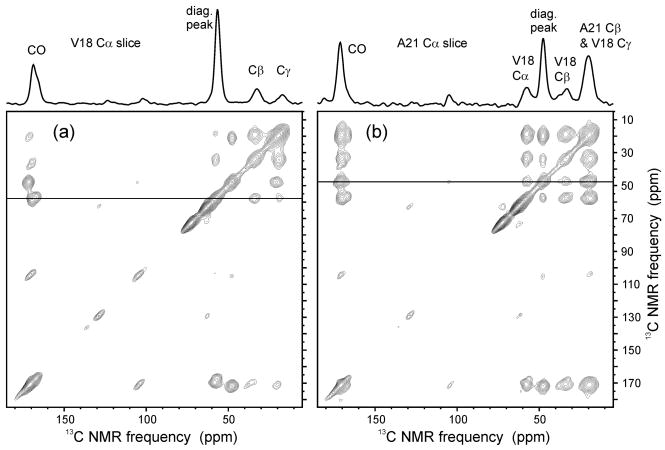
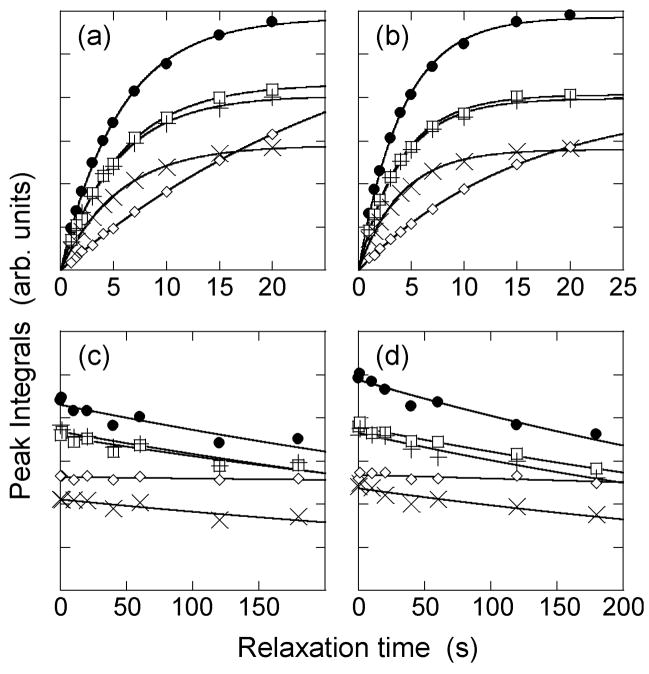
A magic-angle spinning (MAS) probe has been constructed which allows the sample to be cooled with helium, while the MAS bearing and drive gases are nitrogen. The sample can be cooled to 25K using roughly 3 L/h of liquid helium, while the 4-mm diameter rotor spins at 6.7 kHz with good stability (+/-5 Hz) for many hours. Proton decoupling fields up to at least 130 kHz can be applied. This helium-cooled MAS probe enables a variety of one-dimensional and two-dimensional NMR experiments on biomolecular solids and other materials at low temperatures, with signal-to-noise proportional to 1/T. We show examples of low-temperature (13)C NMR data for two biomolecular samples, namely the peptide Abeta(14-23) in the form of amyloid fibrils and the protein HP35 in frozen glycerol/water solution. Issues related to temperature calibration, spin-lattice relaxation at low temperatures, paramagnetic doping of frozen solutions, and (13)C MAS NMR linewidths are discussed.


Figures

Figure 1
Figure 1
(a) Cross-section of MAS unit of helium-cooled low temperature solid state NMR probe. Cold helium (red arrow) enters the MAS unit through the tube labeled A. The sample (green) sits in the sample space region defined by two Teflon pieces (yellow), which fit together to hold the NMR coil and separate the helium-cooled sample space from the nitrogen gas. Helium gas exits the sample space in the small gap around the circumference of the rotor. Both the nitrogen gas, used for the air bearings (B) and for spinning, and the helium gas can vent from the MAS unit on either side of each of the bearings (blue arrows). For stable spinning, the rotor requires a “pointer” (C) which acts to dampen vibration of the rotor. (b) Photograph of the probe head, with outer aluminum can removed. Arrows indicate the helium entry tube (1), optical fibers for MAS tachometer (2), fiber optic temperature sensor (3), hinged pointer for stabilizing spinning (4), shim coil (5), bearing gas supply tubes (6), MAS angle adjust rod (7), Teflon baffle (8), tuning and matching capacitors for 13C channel (9).
Figure 2
Figure 2
(a) 13C MAS NMR spectra of 13CH3-labeled sodium acetate dissolved in frozen glycerol/water with 200 μM DyEDTA, recorded at 25 K (heavy solid line), 40 K (dashed line), and 79 K (thin line). Spectra are on the same vertical scale. Each spectrum is the result of four scans, recorded with 7.00 kHz MAS, 1H-13C cross-polarization (1.5 ms), and 105 kHz 1H decoupling. Recycle delays were 33 to 56 s, sufficient for complete spin-lattice relaxation between scans. (b) Peak integrals as a function of inverse temperature (● acetate CH3, □ glycerol). Lines show linear fits, indicating a linear dependence of the cross-polarized 13C NMR signal on 1/T.
Figure 3
Figure 3
(a) 2D 13C-13C NMR spectrum of Aβ14–23 fibrils with uniform 15N and 13C labeling of V18 and A21, acquired at 25 K with RFDR recoupling in the 1.2 ms mixing period. A 1D slice is shown at the V18 13Cα chemical shift, with intra-residue crosspeaks labeled. (b) 2D 13C-13C NMR spectrum with spin diffusion in the 500 ms mixing period. A 1D slice is shown at the A21 13Cα chemical shift, with inter-residue and intra-residue crosspeaks labeled. Each spectrum was acquired in 3.5 hours (2048 total scans, recycle delay 6 s, 6.7 kHz MAS).
Figure 4
Figure 4
Frequency-selective dipolar recoupling of A21 13CO and 13Cα spins in Aβ14–23 fibrils at 25 K, using the SEASHORE technique with POST-C7 double-quantum recoupling. Dashed, solid, and dotted lines are simulations for two-spin systems with 1.40 Å, 1.50 Å, and 1.60 Å internuclear distances, including anisotropic chemical shifts. A 5 ms exponential decay was applied to the simulated curves to match the damping of the experimental oscillations.
Figure 5
Figure 5
(a) 2D 13C-13C NMR spectrum of HP35 with 400 μM DyEDTA, acquired with RFDR recoupling in the 2.4 ms mixing period. (b,c,d) Expansions of CO-Cα crosspeak region for HP35 with 400 μM, 200 μM, and 600 μM DyEDTA, respectively. (e) 1D slices through spectrum with 200 μM DyEDTA at 52.9 ppm and 55.1 ppm. Spectra obtained at 25 K with 6.70 kHz MAS. (For 200 μM DyEDTA: 0.55 mg HP35 in 48 μl glycerol/water (3:2 ratio by volume), 1H T1 = 5.3 s, recycle delay = 7 s, 2148 total scans. For 400 μM DyEDTA: 0.76 mg HP35 in 48μl glycerol/water (1:1), 1H T1 = 3.3 s, recycle delay = 5 s, 2048 total scans. For 600 μM: 0.79 mg HP35 in 48 μl glycerol/water (1:1), 1H T1 = 3.0 s, recycle delay = 3.75 s, 8192 total scans.)
Figure 6
Figure 6
79Br (●) and 81Br (□) spin-lattice relaxation time T1 in KBr powder as a function of temperature. Longer T1 values for 81Br reflect a quadrupolar relaxation mechanism.
Figure 7
Figure 7
35Cl NQR frequency in NaClO3 powder as a function of temperature.
Figure 8
Figure 8
Recovery of 1H spin polarization (i.e., 1H T1 data) detected through cross-polarized 13C NMR signals as a function of recycle delay in a frozen solution of Aβ14–23 fibrils in glycerol/water without paramagnetic dopant at 20 K (a) and with 160 μM DyEDTA at 25 K (b). Decay of 13C spin polarization (i.e., 13C T1 data) as a function of relaxation time for the same samples without dopant (c) and with dopant (d). Symbols are: ● = V18 13Cγ and A21 13Cβ; □ = V18 and A21 13CO; + = V18 13Cβ; × = A21 13Cα; ◇ = natural-abundance glycerol 13C. Solid lines are fits to exponential recovery (a,b) and decay (c,d) curves.
Figure 9
Figure 9
Recovery of 1H spin polarization (i.e., 1H T1 data) detected through cross-polarized 13C signals as a function of recycle delay in a frozen solution of HP35 in glycerol/water solution with 200 μM DyEDTA at 25 K. Symbols are: ● = HP35 13Cβ, 13Cγ, and 13Cδ; □= HP35 13CO; ◇ = natural-abundance glycerol 13C. Solid lines are fits to exponential recovery curves.

References

    1. Kuhns PL, Lee SH, Coretsopoulos C, Hammel PC, Gonen O, Waugh JS. A low-temperature NMR probe for use in a dilution refrigerator. Rev Sci Instrum. 1991;62:2159–2162.
    1. Waugh JS, Gonen O, Kuhns P. Fourier-transform NMR at low temperatures. J Chem Phys. 1987;86:3816–3818.
    1. Hoult DI, Richards RE. The signal-to-noise ratio of the nuclear magnetic resonance experiment. J Magn Reson. 1976;24:71–85. - PubMed
    1. Kovacs H, Moskau D, Spraul M. Cryogenically cooled probes: A leap in NMR technology. Prog Nucl Magn Reson Spectrosc. 2005;46:131–155.
    1. Michal CA, Tycko R. Stray-field NMR imaging and wavelength dependence of optically pumped nuclear spin polarization in InP. Phys Rev B. 1999;60:8672–8679.

Publication types

LinkOut - more resources