. 2008 Oct 14;1(41):ra9.
doi: 10.1126/scisignal.1162396.

BDNF selectively regulates GABAA receptor transcription by activation of the JAK/STAT pathway

Affiliations

BDNF selectively regulates GABAA receptor transcription by activation of the JAK/STAT pathway

Ingrid V Lund et al. Sci Signal. .

Abstract

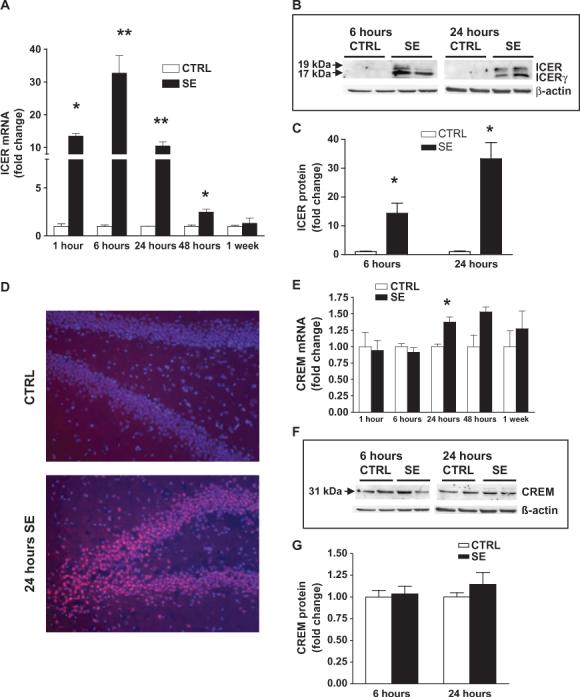
The gamma-aminobutyric acid (GABA) type A receptor (GABA(A)R) is the major inhibitory neurotransmitter receptor in the brain. Its multiple subunits show regional, developmental, and disease-related plasticity of expression; however, the regulatory networks controlling GABA(A)R subunit expression remain poorly understood. We report that the seizure-induced decrease in GABA(A)R alpha1 subunit expression associated with epilepsy is mediated by the Janus kinase (JAK)/signal transducer and activator of transcription (STAT) pathway regulated by brain-derived neurotrophic factor (BDNF). BDNF- and seizure-dependent phosphorylation of STAT3 cause the adenosine 3',5'-monophosphate (cAMP) response element-binding protein (CREB) family member ICER (inducible cAMP early repressor) to bind with phosphorylated CREB at the Gabra1:CRE site. JAK/STAT pathway inhibition prevents the seizure-induced decrease in GABA(A)R alpha1 abundance in vivo and, given that BDNF is known to increase the abundance of GABA(A)R alpha4 in a JAK/STAT-independent manner, indicates that BDNF acts through at least two distinct pathways to influence GABA(A)R-dependent synaptic inhibition.


Figures

Fig. 1
Fig. 1
pCREB increases in DG after pilocarpine-induced SE. (A) Representative Western blot of protein homogenates from DG tissue from SE and control rats 1 hour (left) and 24 hours (right) after onset of SE probed with anti-pCREB and anti–β-actin antibodies. (B) Bar graph of densitometry analysis of pCREB protein abundance. pCREB abundance was normalized to β-actin expression to control for loading variability and expressed as fold change relative to mean control values (defined as 1). pCREB protein abundance in DG increased 2.7-fold at 1 hour (n = 4 CTRL, n = 5 SE, *P < 0.05) and 3.1-fold at 24 hours (n = 4 CTRL, n = 6 SE, *P < 0.05) after SE. (C) Representative Western blot of protein homogenates from DG tissue from SE and control rats 1 hour (left) and 24 hours (right) after onset of SE probed with anti-CREB and anti–β-actin antibodies. (D) Bar graph of densitometry analysis of total CREB protein abundance in DG. CREB abundance was normalized to β-actin and evaluated as described for (A). CREB abundance was unchanged at 1 hour (n = 3 CTRL, n = 5 SE) or 24 hours (n = 4 CTRL, n = 5 SE) after SE. (E) Quantification of RT-PCR analysis of CREB mRNA expression in DG from SE and Control rats. CREB expression was normalized to cyclophilin expression in the same samples and expressed as fold change compared to controls (defined as 1). CREB mRNA expression did not change at 1 hour (n = 3 CTRL, n = 4 SE), 6 hours (n = 4 CTRL, n = 6 SE), 48 hours (n = 4 CTRL, n = 6 SE), or 1 week after SE (n = 4 CTRL, n = 5 SE). SE did result in an increase in CREB mRNA expression at 24 hours after SE (2.2-fold, n = 4 CTRL, n = 6 SE, *P < 0.05). (F) Immunocytochemical staining of the DG performed with anti-pCREB primary antibody and rhodamine-conjugated secondary antibody at 1 hour (top, 20× magnification) and 24 hours (bottom, 10× magnification) after SE shows an increase in pCREB expression throughout the DGC layer (right) compared to control (left). All data are presented as mean ± SEM and all statistics were performed with the Mann–Whitney test.
Fig. 2
Fig. 2
ICER increases in DG after SE. (A) Quantification of RT-PCR analysis of ICER mRNA expression in DG at 1, 6, 24, and 48 hours and 1 week after SE. ICER expression was normalized to cyclophilin expression and expressed as fold change compared to controls (defined as 1). ICER showed robust increases in mRNA expression in DG from SE compared to control rats starting at 1 hour after SE and continuing until 48 hours after SE (1 hour: 13.6-fold, n = 4 CTRL, n = 4 SE, *P < 0.05; 6 hours: 32.8-fold, n = 4 CTRL, n = 6 SE, **P < 0.01; 24 hours: 10.5-fold, n = 4 CTRL, n = 6 SE, **P < 0.01; 48 hours: 2.5-fold, n = 5 CTRL, n = 6 SE, *P < 0.05). (B) Representative Western blot of protein homogenates from DG of control and SE adult rats at 6 hours (left) and 24 hours (right) after SE reacted with anti-CREM/ICER antibody (top gel) or anti–β-actin antibody (bottom gel). Note the bands at 19 and 17 kDa corresponding to the size of ICER and ICERγ present in the SE rats that are absent in controls. (C) Bar graph of densitometry analysis of ICER protein. Expression of both bands corresponding to ICER and ICERγ were added and normalized to β-actin expression in the same samples and expressed as fold change relative to controls (defined as 1). ICER protein increased at 6 hours (17.3-fold, n = 4 CTRL, n = 5 SE, *P < 0.05) and at 24 hours (33.3-fold, n = 4 SE, n = 4 CTRL, *P < 0.05). (D) Immunocytochemical staining of the DG performed with rhodamine-tagged anti-CREM/ICER antibody (red) and co-stained with 4′,6′-diamidino-2-phenylindole (blue; 10× magnification). The DGC layer shows widespread ICER/CREM immunostaining at 24 hours after SE (bottom) compared to the nearly absent ICER/CREM staining in controls (top). (E) Quantification of RT-PCR analysis of CREM mRNA expression in DG at 1, 6, 24 and 48 hours and 1 week after SE. CREM expression was normalized to cyclophilin expression and evaluated as described for (A). A modest increase in CREM mRNA was detected in DG only at 24 hours after SE (1.37-fold, n = 4 CTRL, n = 6 SE, *P < 0.05). (F) Representative Western blot of protein homogenates from DG of control and SE adult rats at 6 hours (left) and 24 hours (right) after SE reacted with anti-CREM/ICER antibody (top gel), or anti−β-actin antibody (bottom gel). Note the band at 31 kDa corresponding to CREM-1. G) Bar graph of densitometry analysis of CREM protein. CREM abundance was normalized to β-actin as described for Panel B. CREM protein did not change at either 6 hours (n = 6 CTRL, n = 6 SE) or 24 hours (n = 6 CTRL, n = 6 SE) after SE. All data are presented as mean ± SEM and all statistics were performed with the Mann–Whitney test.
Fig. 3
Fig. 3
Increased pCREB and ICER binding to Gabra1-p after SE is associated with a reduction in the abundance of α1γ2-containing GABAARs in DG. (A) SE alters the abundance of α1 and α4 subunits in γ2-containing GABAARs of the DG. Representative Western blot shows a decrease in α1 and increase in α4 subunit abundance of γ2-containing GABAARs after pilocarpine-induced SE. Coimmunoprecipitation (IP) was performed on DG from animals 24 hours after SE and from controls. Whole-cell protein extracts from DG were applied to the γ2 subunit antibody–coupled AminoLink Plus gel. After overnight incubation, the γ2 subunit antibody–coupled protein complexes were eluted and separated by SDS-PAGE and then followed by Western blot with anti-α1, anti-α4, and anti-γ2 subunit antibodies. Negative controls were performed by coupling normal rabbit IgG to AminoLink Plus gel to test for proteins that may bind nonspecifically. (B) Abundance of α1, α4, and γ2 subunits was quantified by densitometry (*P < 0.05, **P < 0.01; n = 3 rats per group). Normalized data (α1 subunit/γ2 subunit, α4 subunit/γ2 subunit) are presented as mean ± SEM and expressed as percent change with respect to control animals (defined as 100%). (C) Sequence conservation of the CRE site (in gray) in the human and rat α1 promoters. (D and E) Association of Ser133 pCREB with endogenous Gabra1 increases after SE as assayed by ChIP. Genomic DNA and associated protein complexes were collected from the DG of rats 24 hours after SE or controls and immunoprecipitated with an anti-pCREB antibody (Ab). Immunoprecipitated Gabra1 genomic DNA fragments were detected by PCR (D) or real-time PCR (E) with the use of specific primers that flank the CRE site in the rat Gabra1 gene (n = 4 rats per group, **P < 0.01). “Input” lane shows PCR band from genomic DNA before immunoprecipitation (positive control); “−” lane is PCR band from genomic DNA immunoprecipitated with IgG only (negative control); and “+” lane is PCR band from genomic DNA immunoprecipitated with anti-pCREB antibody. (F) As a control for specific antibody precipitation and for the specificity of binding of pCREB to the CRE site in Gabra1, PCR was performed with specific primers that flank a potential C/EBP site that is 545 bp upstream of the Gabra1:CRE. Template for amplification came from genomic DNA fragments immunoprecipitated with anti-pCREB antibody from pooled control and SE DG samples. Note the absence of any detectable binding of pCREB to this region upstream of Gabra1:CRE site (representative result from n = 3). (G) CREB and ICER both bind directly to the CRE site in the Gabra1-p as detected by DNA pull-down assay followed by Western blot. Nuclear extract was obtained from hippocampal tissue 24 hours after SE. Nuclear extract (600 μg) was incubated with 1 mg of streptavidin Dynabeads bound to Gabra1:CRE oligonucleotides (see Materials and Methods). Western blot analysis was performed with anti-CREB antibody and anti–CREM-1 antibody (that recognizes multiple CREM isoforms including ICER). Note detection of ICER and ICERγ after SE (left panel). No other CREM isoforms were detected (right panel). Each binding assay (per condition, control and SE) was performed on 600 μg of nuclear extracts pooled from three control or three SE animals. Data are representative of two independent experiments (three animals pooled per condition per experiment) that both showed a marked increase in the binding of ICER to the GABRA1:CRE 24 hours after SE.
Fig. 4
Fig. 4
GABRA1-p activity depends on pCREB, ICER, and BDNF. (A) Bar graph displaying GABRA1 promoter activity from GABRA1 promoter/luciferase construct transfected into primary cultured hippocampal neurons in comparison with promoterless basic vector. Luciferase activity is shown as counts per minute per microgram protein. (**P < 0.01, mean ± SE; n = 4 per group). Overexpression of ICER or CREB and ICER with the GABRA1 promoter/luciferase reporter construct decreases promoter activity in primary cultured hippocampal neurons compared to control. Luciferase activity (counts per minute) was normalized to the amount of protein (micrograms) in each sample. Results are expressed as percent activity measured from control [GABRA1 promoter/luciferase reporter construct cotransfected with expression vector backbone alone (Vector)], defined as 100% (**P < 0.01; mean ± SE; n = 4 per group). Ser133 phosphorylation of CREB is required for the repression of GABRA1 promoter activity in neurons cotransfected with ICER expression constructs. Hippocampal neurons were cotransfected with ICER and/or the dominant-negative MCREB construct. 24 hours after transfection, cultures were harvested and luciferase assays were performed. Luciferase activity (counts per minute) was normalized to the amount of protein (micrograms) in each sample. Results are expressed as percent activity measured from control [GABRA1 promoter/reporter constructs cotransfected with expression vector backbone alone (Vector)], defined as 100%. (**P < 0.01; mean ± SE; n = 4 per condition). (B) Cultures were treated with either vehicle (H2O) or BDNF (50 ng/ml) for 6 hours. Total RNA was extracted and real-time PCR was performed with PCR primers and probes specific for GABAAR α1 subunit and cyclophilin mRNAs. Experimental data were normalized to cyclophilin. mRNA abundance in each treatment group is expressed relative to the vehicle (H2O) (**P < 0.01; mean ± SE; n = 5). (C and D) Primary cultured hippocampal neurons were treated with either vehicle (H2O) or BDNF (50 ng/ml) for the indicated time. Total RNA or protein was extracted and ICER mRNA or protein abundance was measured by real-time RT-PCR (C) or Western blot (D). Data were normalized to cyclophilin for mRNA measurement (*P < 0.05, **P < 0.01; mean ± SE; n = 4). Proteins were visualized by enhanced chemiluminescence (ECL). β-Actin protein abundance did not vary with BDNF treatment and was used as an internal control. (E and F) BDNF stimulation of primary cultured hippocampal neurons increases pSTAT3 abundance. Hippocampal cultures were treated with vehicle (H2O) or BDNF (50 ng/ml) for 30 min. Cellular protein was extracted and Western blot (E) was performed to determine pSTAT3 abundance. Total STAT3 did not vary with BDNF treatment and was used as a loading control. Normalized data (pSTAT3/STAT3) are presented as a histogram (F) and expressed as percent change with respect to vehicle (Veh)-treated samples (vehicle control is set at 100%; *P <0.05, n = 4).
Fig. 5
Fig. 5
JAK/STAT inhibition restores α1 subunit expression in cultured hippocampal neurons. (A and B) ICER protein/hippocampal cultures were pretreated with a pan JAK inhibitor P6 (500 nM) or vehicle (DMSO) for 1 hour. Cultures were then treated with either vehicle (H2O) or BDNF (50 ng/ml) for an additional 4 hours. Total cellular proteins were extracted. Western blot was performed to determine the abundance of ICER protein. β-Actin abundance did not vary with BDNF treatment and was used as an internal control. A representative Western blot is shown (A). Normalized data (ICER/β-actin) are presented as a bar graph (B) and expressed as percent change with respect to vehicle-treated cultures (defined as 100%). Significant changes are as indicated (*P < 0.05; mean ± SEM; n = 3). Proteins were visualized by ECL. (C) ICER mRNAs: hippocampal cultures were treated as described above. Cultures were harvested and total RNA was extracted. ICER mRNA abundance was measured by real-time RT-PCR and data were normalized to cyclophilin expression (*P < 0.05, **P < 0.01; mean ±SE; n = 4). (D) GABRA1 mRNAs: cultures were treated as described above with the exception that the exposure to BDNF was for 6 hours. α1 mRNA abundance was measured by RT-PCR (*P < 0.05, **P < 0.01; mean ±SE; n = 5). (E and F) pCREB protein: cultures were treated as described above with the exception that exposure to BDNF was for 30 min. Total cellular proteins were analyzed by Western blot with polyclonal CREB and pCREB antibodies. Proteins were visualized by ECL after incubation with an anti-rabbit HRP-conjugated antibody (E). Normalized data (pCREB/CREB) are presented as mean ± SEM and expressed as percent change with respect to vehicle-treated cultures (defined as 100%) (F). Total CREB abundance did not vary with BDNF treatment and was used as an internal control. Significant changes are as indicated (*P < 0.05; mean ± SEM; n = 3). (G) STAT3 siRNA knockdown: BDNF-induced ICER mRNA synthesis is reversed after treatment with STAT3-specific siRNAs (*P < 0.05; n = 5). STAT3 and scramble (control) siRNAs were transfected into primary hippocampal neurons before BDNF treatment (50 ng/ml). After 4 hours of BDNF treatment, RNA was isolated and mRNA expression of ICER was determined by RT-PCR. ICER mRNA expression was normalized to cyclophilin expression to control for loading variability and expressed as percentage change from scramble control (control set at 100%).
Fig. 6
Fig. 6
JAK/STAT inhibition blocks ICER abundance and restores α1 subunit expression in DG after SE. pSTAT3 and pSTAT1 increase after SE. Representative Western blot of protein homogenates of DG tissue from SE and control rats 1, 6, 24, and 48 hours after onset of SE reacted with (A) anti-pSTAT3, (C) anti-pSTAT1, and anti–β-actin antibodies. Bar graphs of densitometry analysis of pSTAT3 (B) and pSTAT1 (D) protein abundance. pSTAT3 and pSTAT1 abundance was normalized to β-actin to control for loading variability and expressed as fold change relative to mean control values (defined as 1). pSTAT3 protein abundance in DG increased 3.8-fold at 1 hour (n = 4 CTRL, n = 5 SE, *P < 0.05), 21.9-fold at 6 hours (n = 4 CTRL, n = 5 SE, *P < 0.05), 8.9-fold at 24 hours (n = 4 CTRL, n = 6 SE, not significant), and 8.6-fold at 48 hours (n = 4 CTRL, n = 5 SE, *P < 0.05) after SE. pSTAT1 protein abundance in DG did not increase at 1 hour (n = 4 CTRL, n = 5 SE) but increased 5.2-fold at 6 hours (n = 4 CTRL, n = 5 SE, *P < 0.05), 10.4-fold at 24 hours (n = 4 CTRL, n = 6 SE, *P < 0.05), and were not significantly different at 48 hours (n = 4 CTRL, n = 5 SE) after SE. All data for (B) and (D) are represented as mean ± SE and all statistics were measured by Mann–Whitney test. (E) Representative Western blot showing amounts of pSTAT3 and ICER in DG tissue 48 hours after administration of a subconvulsive dose of pilocar-pine (CTRL), pilocarpine-induced SE alone (SE), SE after 48 hours of Alzet pump continuous slow infusion (0.5 μl / hour) of DMSO vehicle (veh-SE) or 1 mM P6 infusion into the DG (P6-SE). Animals that were injected with vehicle before undergoing SE (veh-SE) showed amounts of pSTAT3 and ICER comparable to noninjected SE (SE) animals and significantly increased versus control, so SE and veh-SE groups were pooled. (F) Densitometry analysis of pSTAT3 protein. pSTAT3 was normalized to β-actin expression to control for loading amount variability and expressed as fold change relative to mean control values (defined as 1). pSTAT3 abundance was 9.0-fold higher in the SE + veh-SE group versus control (n = 4 CTRL, n = 5 SE + veh-SE, *P < 0.05) but was not significantly higher in P6-SE (n = 4) versus CTRL (P > 0.05). (G) Bar graph of densitometry analysis of ICER protein. ICER was normalized to β-actin expression to control for loading amount variability and expressed as fold change relative to mean control values (defined as 1). ICER abundance was 5.7-fold higher in the SE + veh-SE group versus control (n = 4 CTRL, n = 5 SE + veh-SE, *P < 0.05). Abundance in the P6-SE group was not significantly different from that of control (n = 4 P6-SE, P > 0.05). (H) β-Actin of RT-PCR analysis of ICER mRNA 48 hours after SE. ICER mRNA was normalized to cyclophilin expression to control for loading amount variability and expressed as fold change relative to mean control (n = 4) values (defined as 1). ICER mRNA in DG increased 8.7-fold in rats in the SE + veh-SE group (n = 4 CTRL, n = 6 SE + veh-SE, **P < 0.01) but did not change in the P6-SE group (n = 4 P6-SE, P > 0.05) compared to control. (I) A STAT site in ICER-p. (J) SE increases pSTAT3 binding to endogenous ICER-p in DG of adult rats. ChIP was performed on slices of DG 24 hours after pilocarpine-induced SE or controls. In vivo cross-linked fragments of chromatin-associated DNA were precipitated with antibodies to pSTAT3. Fragmented DNA was amplified with specific primers flanking the STAT sites on the promoter. A representative sample is shown for each treatment group (J). Input is genomic DNA before precipitation with antibody. Presence or absence of antibody is represented as “+” or “−”, respectively. Bar graph showing quantification of pSTAT3 precipitation (K). *P = 0.001 (Student's t test, n = 3 animals per condition. (L) α1 mRNA expression in DG decreased 69% in rats in the SE + veh-SE group (n = 4 CTRL, n = 6 SE + veh-SE, *P < 0.05) but did not change in the P6-SE group (n = 4 P6-SE, P > 0.05) compared to control. Data are represented as mean ± SE and were analyzed statistically with Kruskal–Wallis nonparametric analysis of variance with Dunn posttest to correct for multiple comparisons.

Similar articles

Cited by

References

    1. Rudolph U, Mohler H. GABA-based therapeutic approaches: GABAA receptor sub-type functions. Curr. Opin. Pharmacol. 2006;6:18–23. - PubMed
    1. Sieghart W. Structure, pharmacology, and function of GABAA receptor subtypes. Adv. Pharmacol. 2006;54:231–263. - PubMed
    1. Brooks-Kayal AR, Shumate MD, Jin H, Rikhter TY, Kelly ME, Coulter DA. gamma-Aminobutyric acid(A) receptor subunit expression predicts functional changes in hippocampal dentate granule cells during postnatal development. J. Neurochem. 2001;77:1266–1278. - PubMed
    1. Brooks-Kayal AR, Jin H, Price M, Dichter MA. Developmental expression of GABA(A) receptor subunit mRNAs in individual hippocampal neurons in vitro and in vivo. J. Neurochem. 1998;70:1017–1028. - PubMed
    1. Mohler H. Molecular recognition of cognitive functions and developmental plasticity: Impact of GABA(A) receptors. J. Neurochem. 2007;102:1–12. - PubMed

MeSH terms

LinkOut - more resources