

Small molecule targeting the Hec1/Nek2 mitotic pathway suppresses tumor cell growth in culture and in animal
- PMID: 18922912
- PMCID: PMC2709694
- DOI: 10.1158/0008-5472.CAN-08-1915
Small molecule targeting the Hec1/Nek2 mitotic pathway suppresses tumor cell growth in culture and in animal
Abstract
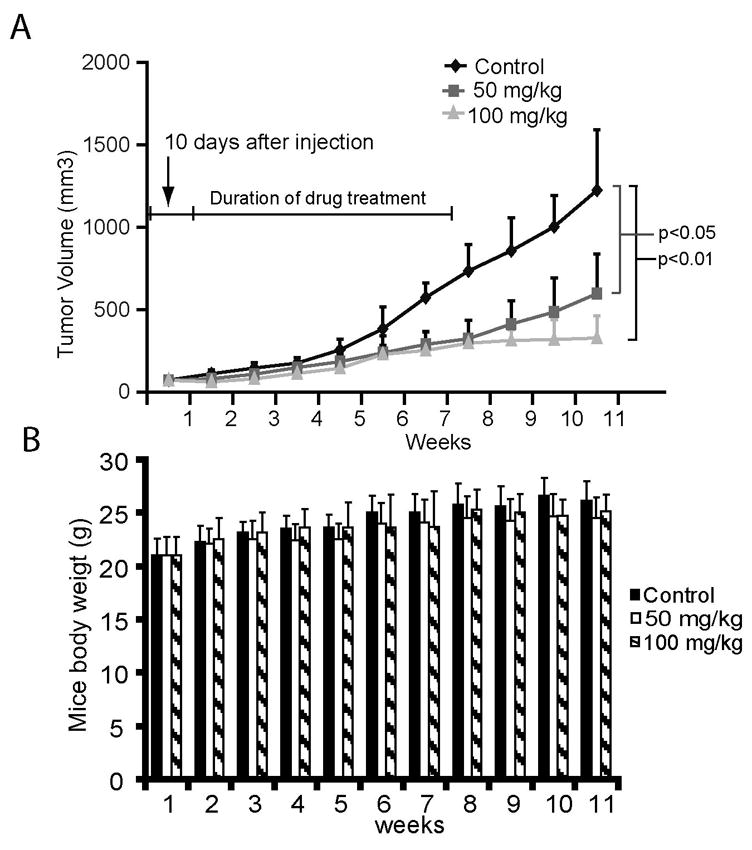
Hec1 is a conserved mitotic regulator critical for spindle checkpoint control, kinetochore functionality, and cell survival. Overexpression of Hec1 has been detected in a variety of human cancers and is linked to poor prognosis of primary breast cancers. Through a chemical genetic screening, we have identified a small molecule, N-(4-[2,4-dimethyl-phenyl]-thiazol-2-yl)-benzamide (INH1), which specifically disrupts the Hec1/Nek2 interaction via direct Hec1 binding. Treating cells with INH1 triggered reduction of kinetochore-bound Hec1 as well as global Nek2 protein level, consequently leading to metaphase chromosome misalignment, spindle aberrancy, and eventual cell death. INH1 effectively inhibited the proliferation of multiple human breast cancer cell lines in culture (GI(50), 10-21 micromol/L). Furthermore, treatment with INH1 retarded tumor growth in a nude mouse model bearing xenografts derived from the human breast cancer line MDA-MB-468, with no apparent side effects. This study suggests that the Hec1/Nek2 pathway may serve as a novel mitotic target for cancer intervention by small compounds.
Figures


Similar articles
-
Novel small molecules disrupting Hec1/Nek2 interaction ablate tumor progression by triggering Nek2 degradation through a death-trap mechanism.Oncogene. 2015 Mar 5;34(10):1220-30. doi: 10.1038/onc.2014.67. Epub 2014 Mar 24. Oncogene. 2015. PMID: 24662830 Free PMC article.
-
Discovery of 4-aryl-N-arylcarbonyl-2-aminothiazoles as Hec1/Nek2 inhibitors. Part I: optimization of in vitro potencies and pharmacokinetic properties.J Med Chem. 2014 May 22;57(10):4098-110. doi: 10.1021/jm401990s. Epub 2014 May 7. J Med Chem. 2014. PMID: 24773549
-
Characterization of the biological activity of a potent small molecule Hec1 inhibitor TAI-1.J Exp Clin Cancer Res. 2014 Jan 9;33(1):6. doi: 10.1186/1756-9966-33-6. J Exp Clin Cancer Res. 2014. PMID: 24401611 Free PMC article.
-
Role of NIMA-related kinase 2 in lung cancer: Mechanisms and therapeutic prospects.Fundam Clin Pharmacol. 2022 Oct;36(5):766-776. doi: 10.1111/fcp.12777. Epub 2022 Apr 2. Fundam Clin Pharmacol. 2022. PMID: 35338518 Review.
-
Targeting NEK2 as a promising therapeutic approach for cancer treatment.Cell Cycle. 2016;15(7):895-907. doi: 10.1080/15384101.2016.1152430. Cell Cycle. 2016. PMID: 27019372 Free PMC article. Review.
Cited by
-
An RNA interference lethality screen of the human druggable genome to identify molecular vulnerabilities in epithelial ovarian cancer.PLoS One. 2012;7(10):e47086. doi: 10.1371/journal.pone.0047086. Epub 2012 Oct 9. PLoS One. 2012. PMID: 23056589 Free PMC article.
-
Novel small molecules disrupting Hec1/Nek2 interaction ablate tumor progression by triggering Nek2 degradation through a death-trap mechanism.Oncogene. 2015 Mar 5;34(10):1220-30. doi: 10.1038/onc.2014.67. Epub 2014 Mar 24. Oncogene. 2015. PMID: 24662830 Free PMC article.
-
Alp7/TACC recruits kinesin-8-PP1 to the Ndc80 kinetochore protein for timely mitotic progression and chromosome movement.J Cell Sci. 2015 Jan 15;128(2):354-63. doi: 10.1242/jcs.160036. Epub 2014 Dec 3. J Cell Sci. 2015. PMID: 25472718 Free PMC article.
-
Overexpression of NIMA-related kinase 2 is associated with poor prognoses in malignant glioma.J Neurooncol. 2017 May;132(3):409-417. doi: 10.1007/s11060-017-2401-4. Epub 2017 Mar 21. J Neurooncol. 2017. PMID: 28321704
-
Targeting NEK Kinases in Gastrointestinal Cancers: Insights into Gene Expression, Function, and Inhibitors.Int J Mol Sci. 2025 Feb 25;26(5):1992. doi: 10.3390/ijms26051992. Int J Mol Sci. 2025. PMID: 40076620 Free PMC article. Review.
References
-
- Jordan MA, Wilson L. Microtubules as a target for anticancer drugs. Nat Rev Cancer. 2004;4:253–65. - PubMed
-
- Trudeau ME. Docetaxel: a review of its pharmacology and clinical activity. The Canadian journal of oncology. 1996;6:443–57. - PubMed
-
- Taylor S, Peters JM. Polo and Aurora kinases: lessons derived from chemical biology. Curr Opin Cell Biol. 2008;20:77–84. - PubMed
-
- Sakowicz R, Finer JT, Beraud C, et al. Antitumor activity of a kinesin inhibitor. Cancer Res. 2004;64:3276–80. - PubMed
-
- Tao W, South VJ, Zhang Y, et al. Induction of apoptosis by an inhibitor of the mitotic kinesin KSP requires both activation of the spindle assembly checkpoint and mitotic slippage. Cancer Cell. 2005;8:49–59. - PubMed
Publication types
MeSH terms
Substances
Grants and funding
LinkOut - more resources
Full Text Sources
Other Literature Sources
Research Materials
Miscellaneous
