Comparative Study
. 2008 Oct 15;28(42):10711-9.
doi: 10.1523/JNEUROSCI.3853-08.2008.

Noradrenergic induction of odor-specific neural habituation and olfactory memories

Affiliations
Comparative Study

Noradrenergic induction of odor-specific neural habituation and olfactory memories

Stephen D Shea et al. J Neurosci. .

Abstract

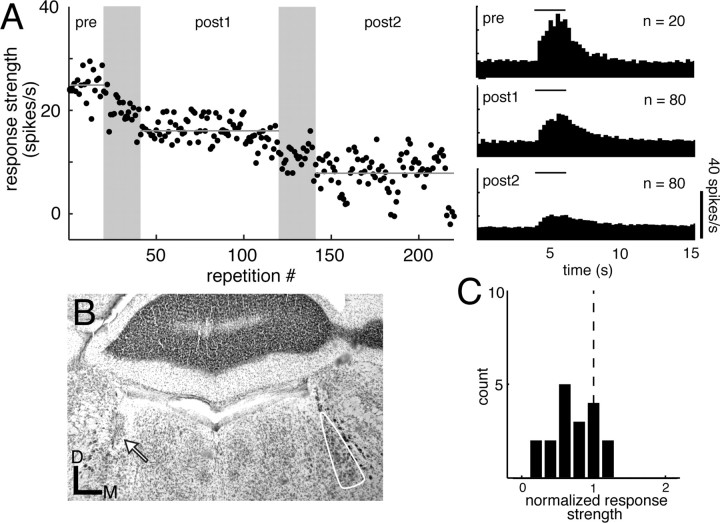
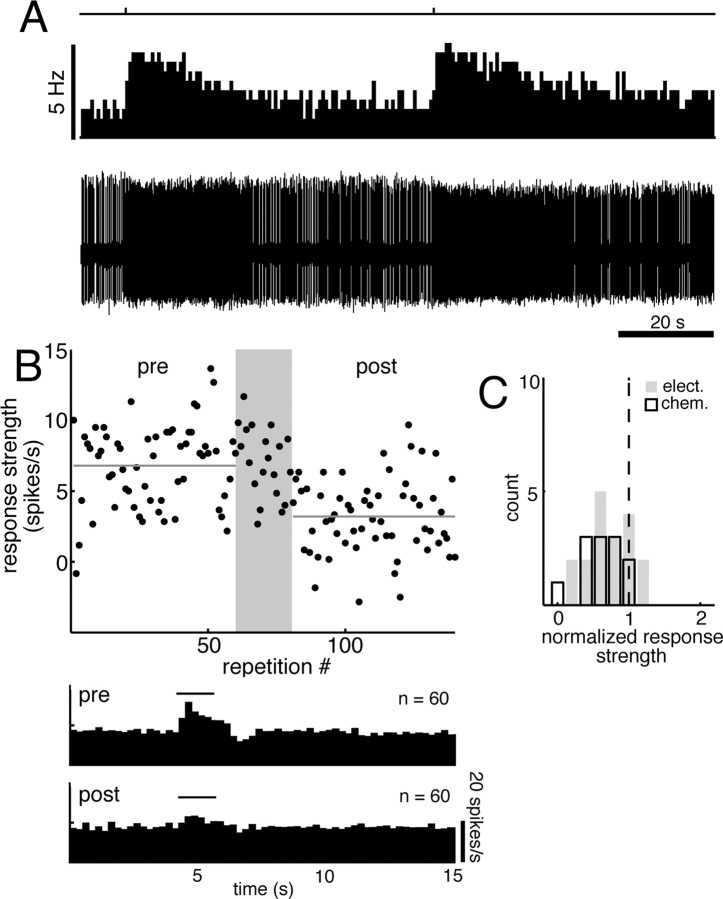
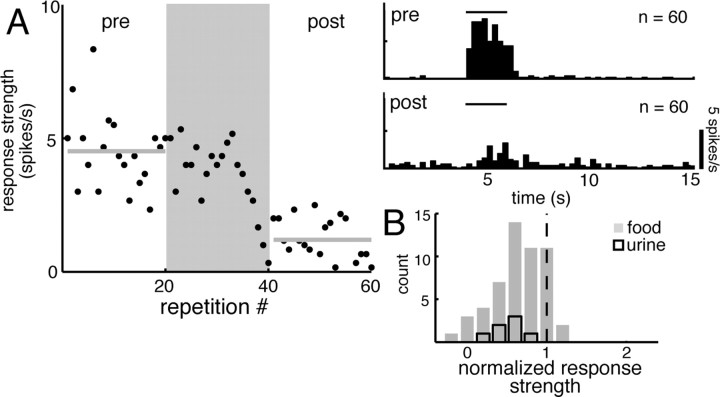
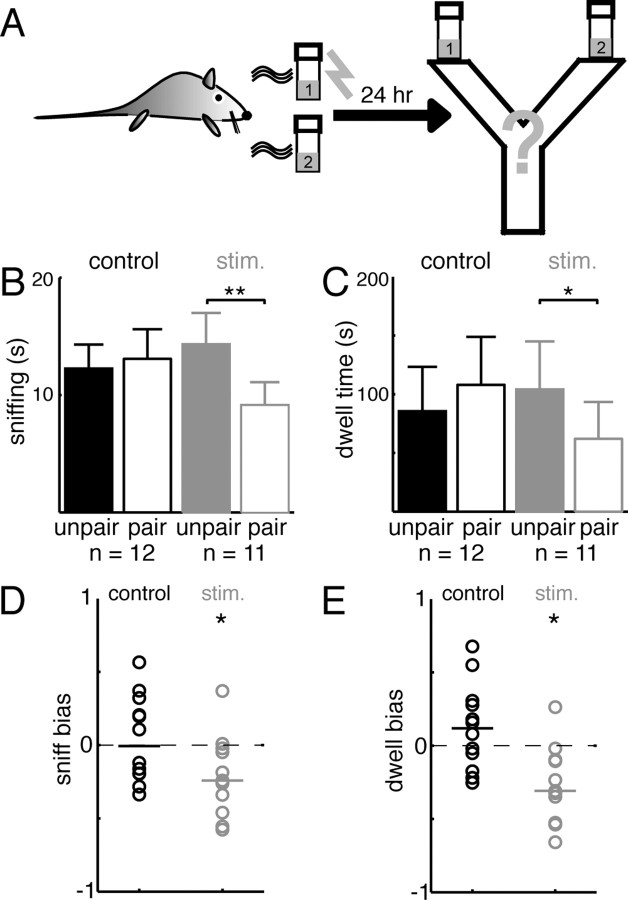
For many mammals, individual recognition of conspecifics relies on olfactory cues. Certain individual recognition memories are thought to be stored when conspecific odor cues coincide with surges of noradrenaline (NA) triggered by intensely arousing social events. Such familiar stimuli elicit reduced behavioral responses, a change likely related to NA-dependent plasticity in the olfactory bulb (OB). In addition to its role in these ethological memories, NA signaling in the OB appears to be relevant for the discrimination of more arbitrary odorants as well. Nonetheless, no NA-gated mechanism of long-term plasticity in the OB has ever been directly observed in vivo. Here, we report that NA release from locus ceruleus (LC), when coupled to odor presentation, acts locally in the main OB to cause a specific long-lasting suppression of responses to paired odors. These effects were observed for both food odors and urine, an important social recognition cue. Moreover, in subsequent behavioral tests, mice exhibited habituation to paired urine stimuli, suggesting that this LC-mediated olfactory neural plasticity, induced under anesthesia, can store an individual recognition memory that is observable after recovery.


Figures

Figure 1.
Figure 1.
Pairing odors with LC stimulation suppresses odor responses in the MOB. A, Odor response suppression. Left, Odor-evoked firing rate above spontaneous discharge is plotted for a series of 220 presentations of cumin. During the shaded periods, each of 20 presentations was paired with a 5 s, 5 Hz, 40 μA train of biphasic electrical pulses applied to LC. Each pairing period resulted in a significant lasting suppression of the response to the odor. Right, Peristimulus time histograms show the mean response in each denoted epoch. B, Micrograph of an LC-stimulation site. One intact LC (right) is visible, outlined in white in this Nissl-stained coronal section. A marking lesion denoting the stimulation site in A is evident in the opposite LC (left, arrow). D, Dorsal; M, medial. C, Histogram of effects of LC stimulation. Here and in similar graphs, the poststimulation response (normalized to baseline) is plotted for each of 18 electrical LC-stimulation cases with a single odor.
Figure 2.
Figure 2.
Pairing an odor with chemical LC stimulation suppresses odor responses in the MOB. A, LC response to carbachol injection. Top, The trace shows the timing of two 20 ms, 10 psi puffs of 100 μm carbachol applied to LC. Bottom, The spike rate histogram and raw trace reflect the response of a nearby LC neuron. B, Odor response suppression. Odor-evoked firing rate above spontaneous discharge is plotted for a series of 140 presentations of clove. During the shaded period, each of 20 presentations was paired with a 20 ms, 10 psi puff of 100 μm carbachol applied to LC. Pairing resulted in a significant lasting suppression of the response to the odor. Peristimulus time histograms below show the mean prepairing and postpairing response. C, Histogram of effects of LC stimulation. Effects of all chemical LC stimulations with a single odor are shown, compared with similar experiments using electrical stimulation.
Figure 3.
Figure 3.
Pairing an odor with LC stimulation after local injection of NA antagonists fails to suppress odor responses in the MOB. A, Odor response is not suppressed. Top, Odor-evoked firing rate above spontaneous discharge is plotted for a series of 140 presentations of cardamom. At the arrow, two 400 ms, 3 psi puffs of 1 mm phentolamine and 1 mm propranolol were made local to the recorded cell. During the shaded period, each of 20 presentations was paired with a 5 s, 5 Hz, 40 μA train of biphasic electrical pulses applied to LC. The odor response was unaffected by pairing. Bottom, Peristimulus time histograms show the mean prepairing and postpairing response. B, Mean population effects of LC stimulation with NA antagonists. Normalized baseline odor responses (black; 1 for all sites by definition) are compared with mean post-LC stimulation responses (white) for control electrical stimulation, stimulation with saline injections, and stimulation with NA antagonist injections. Bars show mean and SEM (Wilcoxon signed rank test, **p < 0.01, *p < 0.05). D, Histogram of effects of LC stimulation. Effects of all LC stimulations with antagonist treatment are shown and compared with control electrical stimulation.
Figure 4.
Figure 4.
LC-mediated odor response suppression is stimulus-specific. A, Stimulus-specific odor response suppression. Top, Odor-evoked firing rate above spontaneous discharge in response to the preferred odor (lemon) of this cell is plotted for a series of 100 presentations. Lemon was interleaved with presentation of three nonpreferred odors. During the shaded periods, each of 10 presentations of either a nonpreferred odor (antipair) or the preferred odor (pair) was paired with a 5 s, 5 Hz, 50 μA train of biphasic electrical pulses applied to LC. Only the pair condition significantly suppressed the response. Bottom, Peristimulus time histograms show the mean response in each denoted epoch. B, Mean population effects of LC stimulation. Normalized baseline odor responses (black; 1 by definition) are compared with mean post-LC stimulation responses (white) for pair and antipair stimulation. Bars show mean and SEM (poststimulation responses significantly lower than 1, Wilcoxon signed rank test, **p < 0.001). C, Histogram of effects of LC stimulation. Effects of all LC stimulations are shown for electrical stimulation in the pair (black) and antipair (gray) conditions.
Figure 5.
Figure 5.
Pairing urine with LC stimulation suppresses responses to urine. A, Urine response suppression. Left, Odor-evoked firing rate above spontaneous discharge is plotted for a series of 60 presentations of urine. During the shaded period, each of 20 presentations was paired with a 5 s, 5 Hz, 40 μA train of biphasic electrical pulses applied to LC. Pairing resulted in a significant lasting suppression of the response to urine. Right, Peristimulus time histograms show the mean response in each denoted epoch. C, Histogram of effects of LC stimulation. Effects of all electrical LC stimulations with urine are shown, compared with all electrical stimulations with food stimuli.
Figure 6.
Figure 6.
Mice show behavioral habituation to LC-stimulation-paired urine. A, Behavioral habituation testing paradigm. Mice were exposed to two urine samples under anesthesia, and one was paired to LC electrical stimulation. The mice were placed 24 h later in a Y-maze containing both urine samples, and investigation time was measured for both stimuli. B–E, Behavioral data. B, C, Mean absolute investigation time is compared between stimuli for control and stimulated (stim.) mice, quantified as direct sniffing (B) or dwelling (C). Bars show mean and SEM (paired t test, *p < 0.05, **p < 0.001). D, E, A normalized measure of bias is shown for control and stimulated mice, calculated from direct sniffing (D) or dwelling (E). Lines show median values (bias significantly different from 1, Wilcoxon signed rank test, *p < 0.05). The design was balanced for the urine stimuli used, and subjects showed no systematic preference for any of the three strains contributing urine (supplemental Fig. 5, available at www.jneurosci.org as supplemental material).

Similar articles

Cited by

References

    1. Adams LM, Foote SL. Effects of locally infused pharmacological agents on spontaneous and sensory-evoked activity of locus coeruleus neurons. Brain Res Bull. 1988;21:395–400. - PubMed
    1. Araneda RC, Firestein S. Adrenergic enhancement of inhibitory transmission in the accessory olfactory bulb. J Neurosci. 2006;26:3292–3298. - PMC - PubMed
    1. Aston-Jones G, Cohen JD. An integrative theory of locus coeruleus-norepinephrine function: adaptive gain and optimal performance. Annu Rev Neurosci. 2005;28:403–450. - PubMed
    1. Berridge CW, Abercrombie ED. Relationship between locus coeruleus discharge rates and rates of norepinephrine release within neocortex as assessed by in vivo microdialysis. Neuroscience. 1999;93:1263–1270. - PubMed
    1. Berridge CW, Waterhouse BD. The locus coeruleus-noradrenergic system: modulation of behavioral state and state-dependent cognitive processes. Brain Res Brain Res Rev. 2003;42:33–84. - PubMed

Publication types