Comparative Study
. 2008 Oct 15;28(42):10720-33.
doi: 10.1523/JNEUROSCI.2126-08.2008.

Huntingtin modulates transcription, occupies gene promoters in vivo, and binds directly to DNA in a polyglutamine-dependent manner

Affiliations
Comparative Study

Huntingtin modulates transcription, occupies gene promoters in vivo, and binds directly to DNA in a polyglutamine-dependent manner

Caroline L Benn et al. J Neurosci. .

Abstract

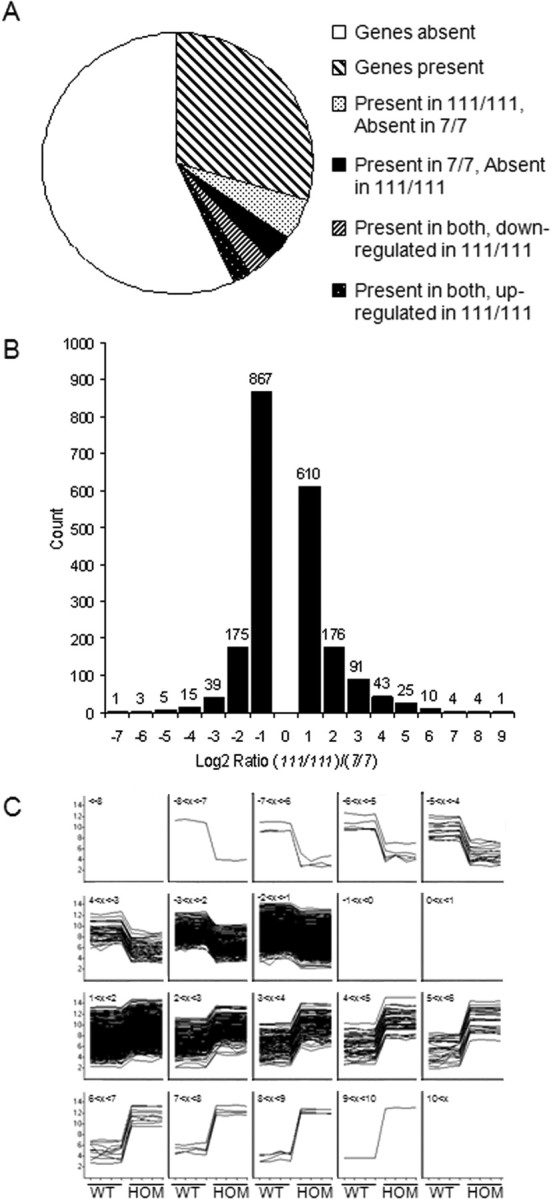
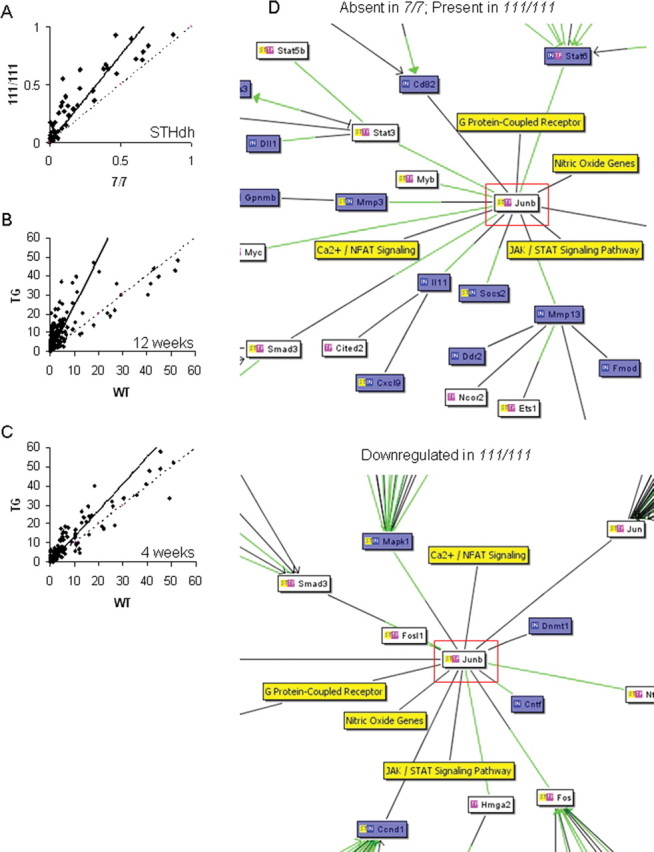
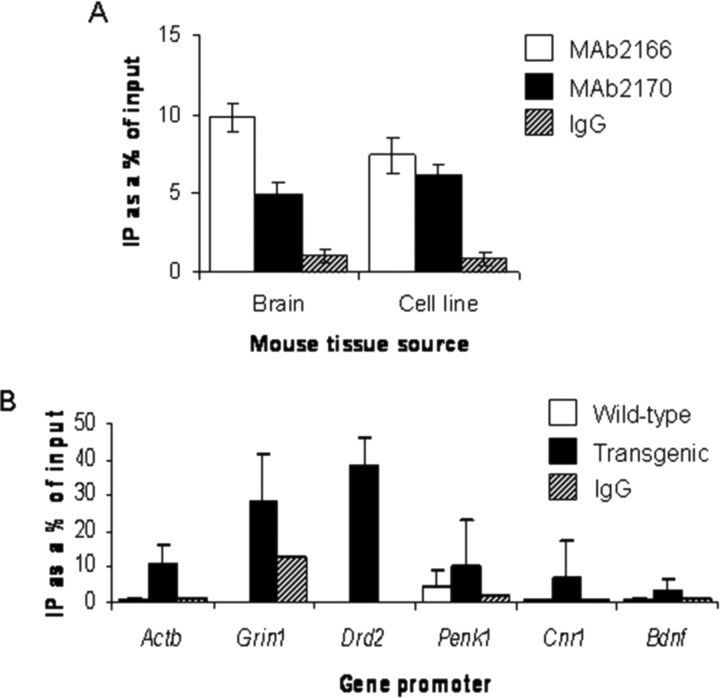
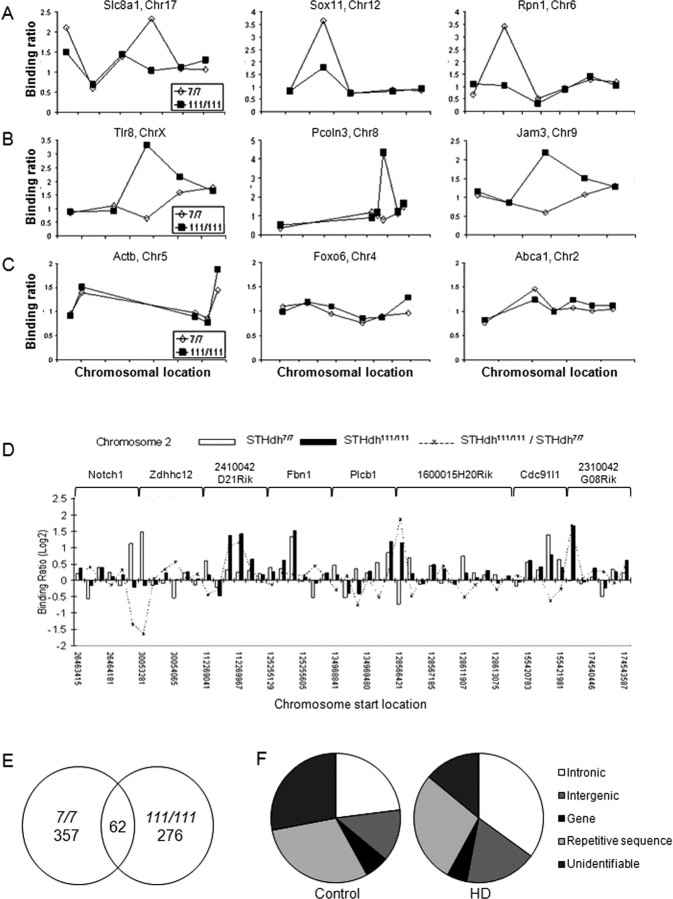
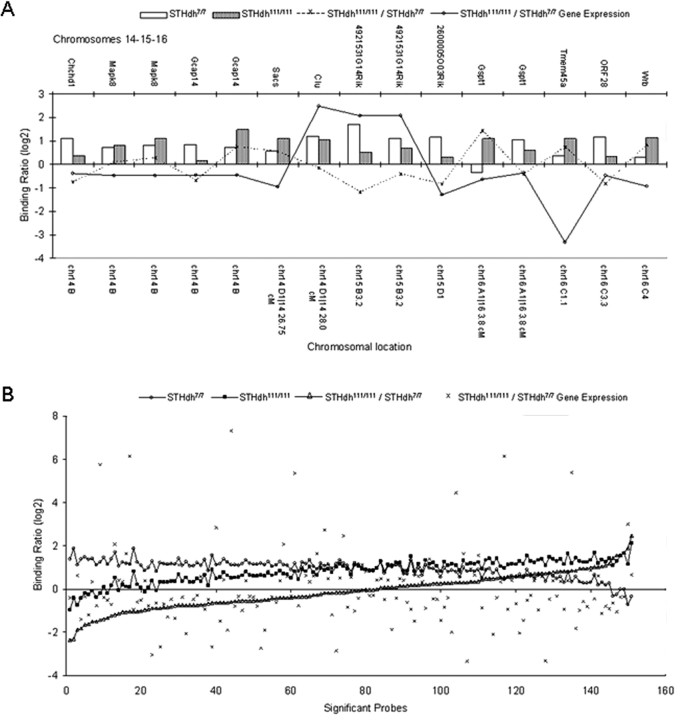
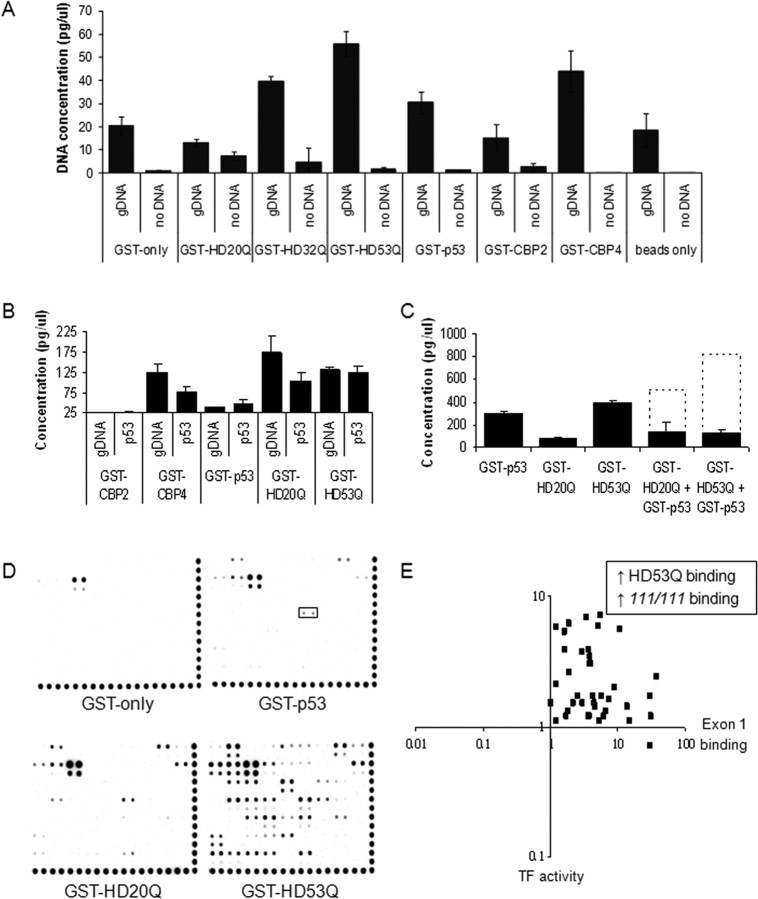
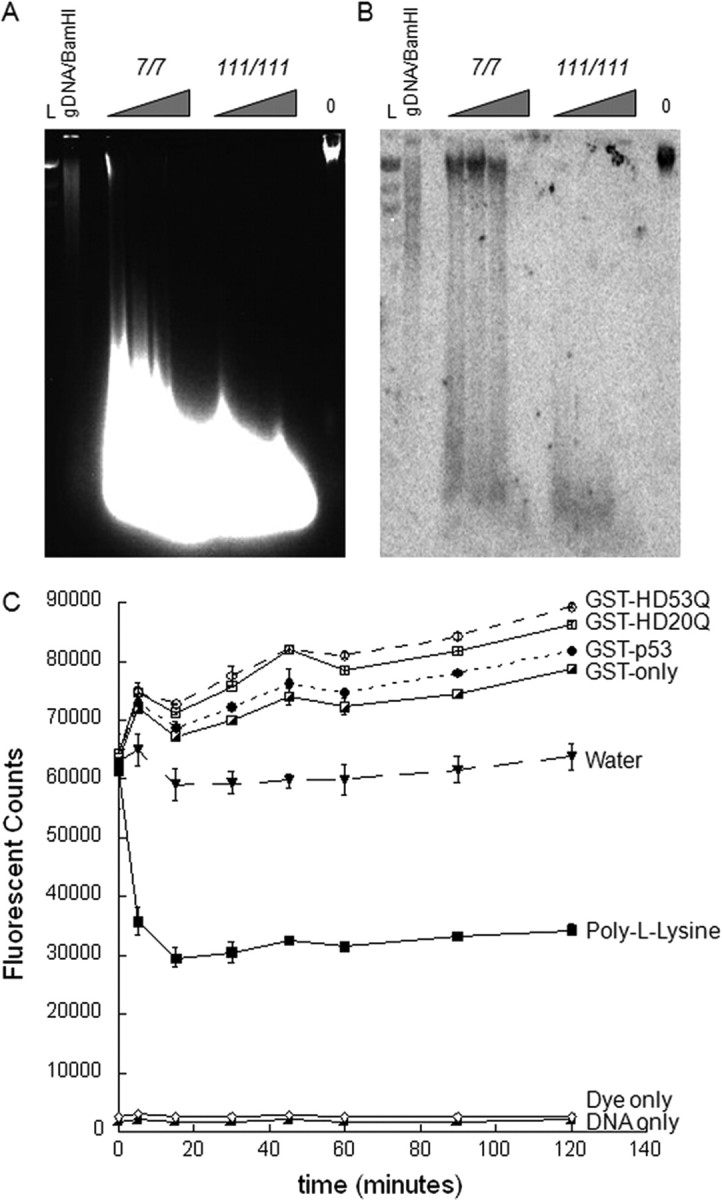
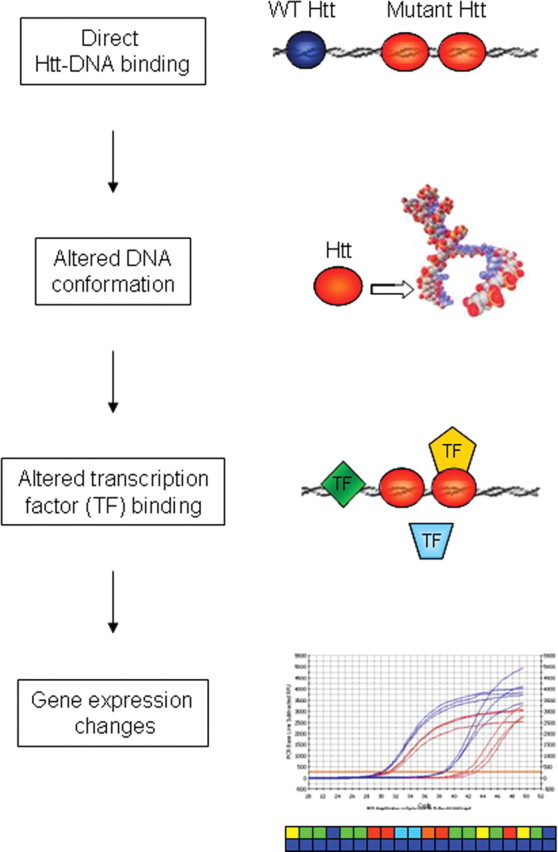
Transcriptional dysregulation is a central pathogenic mechanism in Huntington's disease, a fatal neurodegenerative disorder associated with polyglutamine (polyQ) expansion in the huntingtin (Htt) protein. In this study, we show that mutant Htt alters the normal expression of specific mRNA species at least partly by disrupting the binding activities of many transcription factors which govern the expression of the dysregulated mRNA species. Chromatin immunoprecipitation (ChIP) demonstrates Htt occupation of gene promoters in vivo in a polyQ-dependent manner, and furthermore, ChIP-on-chip and ChIP subcloning reveal that wild-type and mutant Htt exhibit differential genomic distributions. Exon 1 Htt binds DNA directly in the absence of other proteins and alters DNA conformation. PolyQ expansion increases Htt-DNA interactions, with binding to recognition elements of transcription factors whose function is altered in HD. Together, these findings suggest mutant Htt modulates gene expression through abnormal interactions with genomic DNA, altering DNA conformation and transcription factor binding.


Conflict of interest statement

The authors declare no conflict of interest.

Figures

Figure 1.
Figure 1.
mRNA expression profiling reveals gene expression responses to wild-type (WT) or mutant Htt. Comparison of mRNA expression profiles yields numbers of genes present and absent in wild-type STHdh7/7 compared with mutant STHdh111/111 cell lines. A, Pie chart showing the distribution of the present and absent probes. Probes called present were present or marginal in at least three of the four replicates, probes called absent were absent in at least three of four replicates, and probes were called marginal if present and absent in two of the four replicates. More probes were present in STHdh111/111 and absent/marginal in STHdh7/7. B, Distribution of the binned log2(STHdh111/111/STHdh7/7) from the probes called present in both cell lines, with a log2 ratio >1 or less than −1 and a p value <0.05. More probes were downregulated in the STHdh111/111 versus the STHdh7/7, but the amplitude of change (i.e., the difference in expression) was larger for the probes upregulated in the STHdh111/111 versus the STHdh7/7 lines. C, A representation of the log2-normalized intensities for each replicate clustered by the log2 ratio bins determined from the probes called present in both cell lines, with a log2 ratio >1 or less than −1 and a p value <0.05, demonstrating the consistency of the results between the four replicates of each group and the amplitude of the differences between the two groups. The title of each box identifies which of the homozygote (HOM)/wild-type binned data are shown from −7 (top left) to +9 (bottom right). The y-axis shows the magnitude of change for each sample, whereas the x-axis labels identify the wild-type (first four, left) and homozygote (last four, right) samples for each box. Thus, within each bin, the traces represent the fold change in wild-type cells to homozygote cells.
Figure 2.
Figure 2.
Mutant Htt alters the binding of many transcription factors. Densitometric analyses of transcription factor binding activity are scatter plotted, with each point representing the correlation of the binding activity of each transcription factor in two different conditions. Dashed line indicates the predicted correlation if there is no difference in binding activities between the two conditions, whereas the solid line indicates the actual correlation. A, Transcription factor binding activities are increased in the homozygote STHdh111/111 compared with STHdh7/7 cells (measured by film densitometry). B, C, The progressive increase in binding of many transcription factors at 12 weeks in the R6/2 transgenic mouse striatum (B) is evident at the presymptomatic age of 4 weeks (C). D, Increased transcription factor activity does not have straightforward effects on gene expression profiles (Table 1), but correlates well with gene expression changes. Interaction networks from cocitation literature mining generated by the Bibliosphere Pathway view (Genomatix) display the relationship of transcription factors (white boxes), mRNA expression levels (blue boxes), and expression pathways (yellow boxes). The green lines represent a binding site for the relevant transcription factor on the gene promoter. Shown are part of the interaction networks for JunB (highlighted in red), demonstrating different interactions in STHdh7/7 and STHdh111/111 cell lines. JunB exerts two types of gene expression effects (top, mRNA absent in STHdh7/7 and present in STHdh111/111 cells; bottom section shows part of an interaction network for mRNA present in both cell lines but downregulated in STHdh111/111 homozygotes). Full interaction networks generated by the Bibliosphere Pathway view (Genomatix) for each of the four lists of genes are shown in supplemental Figure 1 (available at www.jneurosci.org as supplemental material). JAK, Janus kinase; Fmod, fibromodulin; NFAT, nuclear factor of activated T-cells; STAT, signal transducer and activator of transcription.
Figure 3.
Figure 3.
Htt-gene-promoter occupancy is modulated by polyQ repeat length. A, DNA quantitation of ChIP using different Htt antibodies in wild-type brain and cell lines. MAb2166 (open bars) and MAb2170 (filled bars) compared with IgG or no antibody (hatched bars) shows that significant amounts of DNA are pulled down. Error bars indicate SEM (n = 3–4). B, ChIP with the MAb2170 Htt antibody in R6/2 mouse brain reveals nonselective increases in Htt-promoter occupancy in transgenic mice (filled bars) compared with wild-type mice (open bars), including those for genes whose expression is unchanged [Actb (β-actin) and Grin1 (NMDA receptor NR1 subunit)], and those for genes downregulated in HD [Drd2 (dopamine D2 receptor), Penk1 (preproenkephalin), Cnr1 (cannabinoid receptor 1), and Bdnf (brain derived neurotrophic factor), which is not expressed in striatal neurons]. Hatched bars represent negative control conditions. Error bars indicate SEM (n = 2–4).
Figure 4.
Figure 4.
Genomic binding sites of wild-type and mutant Htt. A–C, Representative examples of binding events for more wild-type Htt (open circles) bound genes [Slc8a1 (solute carrier family 8, member 1), Sox11 (SRY-box containing gene 11), Rpn1 (ribophorin I)] (A), more mutant Htt (filled squares) bound genes (Tlr8 [Toll-like receptor 8], Pcoln3 [procollagen (type III) N-endopeptidase], Jam3 [junction adhesion molecule 3]) (B), and genes showing no difference between wild-type and mutant Htt [Actb (cytoplasmic β-actin), Foxo6 (forkhead box O6), Abca2 (ATP-binding cassette, subfamily A, member 2)] (C). For A–C, binding ratios (y-axis) are plotted against chromosomal location (x-axis) for STHdh7/7 (open circles) and STHdh111/111 (filled squares), although the precise chromosomal location on the x-axis is omitted for simplicity. D, Genes on chromosome 2 for which significant binding events have been identified include those bound more by wild-type Htt (open bars), and those with increased binding by mutant Htt (filled bars). Shown are relative binding levels for each probe and the ratio of mutant/wild-type Htt binding (y-axis), plotted as a function of chromosomal probe localization (x-axis), with the genes indicated (top). E, Genes bound in STHdh7/7 (419) and STHdh111/111 (338) cell lines show little overlap (62), suggesting that wild-type and mutant Htt may have distinct targets. F, ChIP subcloning analysis using control and HD patient brain as a source material shows that the majority of clones bind within intronic or intergenic regions as opposed to proximal promoters.
Figure 5.
Figure 5.
No correlation between ChIP-on-chip data and mRNA expression profiling. A, ChIP-on-chip binding ratios (dashed line) for STHdh7/7 (open bars) and STHdh111/111 (filled bars) do not show a straightforward correlation with mRNA expression level changes (solid line) on a gene-by-gene basis: shown are representative combined data from ChIP-on-chip and gene expression studies for significant genes on chromosomes 14, 15, and 16. B, ChIP-on-chip binding ratios (open triangles, ranked in order) and gene expression profiles (crosses) show no correlation at a global level. Also plotted are STHdh7/7 (open circles) and STHdh111/111 (filled squares) binding ratios.
Figure 6.
Figure 6.
Exon 1 Htt binds nonspecifically to DNA directly in the absence of other proteins in a polyQ-dependent manner. A, Validation of the DIP technique with known DNA interactors [DNA-binding domains of CBP (GST-CBP4, GST-CBP1), GST-p53] and proteins known not to interact with DNA [GST-only, non-DNA-binding domains of CBP (GST-CBP2, GST-CBP5)]. Exon 1 Htt proteins bind significant amounts of genomic DNA, with expanded repeats (GST-HD32Q and GST-HD53Q) typically binding equivalent or more DNA than wild type (HD20Q). Error bars are SEM (n = 4). B, Exon 1 Htt proteins bind a p53 consensus sequence, as does the nonspecific DNA-binding domain of GST-CBP4. C, Exon 1 Htt proteins interfere with GST-p53 DNA binding. The dashed line indicates the predicted amount of genomic DNA binding (estimated by adding the level of binding of GST-p53 and the exon 1 Htt protein species). D, DNA binding by GST fusion proteins on a transcription factor array shows appropriate binding by GST-p53 to its recognition element (boxed area) in addition to some ectopic binding, some of which is explained through GST-only. The GST-HD20Q binding pattern resembles that GST-p53; however, the polyQ repeat expansion in GST-HD53Q potentiates DNA binding. Binding levels were not normalized, because we assayed the presence/absence of binding only. E, Comparing GST–protein binding ratios (HD53Q/GST-HD20Q) with transcription factor activity in cell lines (STHdh111/111/STHdh7/7) shows that transcription factor recognition elements with more binding in HD conditions are those bound by pure mutant exon 1 Htt in vitro (Table 2).
Figure 7.
Figure 7.
Mutant Htt may contribute to a more open DNA conformation. A, Micrococcal nuclease assay on STHdh7/7 and STHdh111/111 cell lines show more digestion in the mutant Htt cell lines than the wild-type cell lines, which suggests a more open conformation of DNA, facilitating access of the enzyme. Triangles represent amounts of titrated MNase enzyme (from 2.5 to 12.5 units). Also shown is control genomic DNA from STHdh111/111 cell lines with 0 units of MNase enzyme. L is the λHindIII DNA ladder. B, Southern hybridization of a cathepsin H (Ctsh)-specific probe to the MNase-digested chromosomal DNA revealed the presence of high-molecular-weight fragments in the STHdh7/7 cell lines only, with levels of radiolabeled probe binding to high-molecular-weight fragment much higher than levels of high-molecular-weight DNA in the native gel. In contrast, the Ctsh probe hybridized only to low-molecular-weight fragments in the homozygote STHdh111/111 cell lines, suggesting a more open chromatin conformation accessible to digestion by MNase. Probes specific for other genes have demonstrated a similar pattern (data not shown). C, Exon 1 Htt exerts distinct polyQ-dependent effects on DNA conformation, as assayed by DNA–YOYO-1 fluorescence. Addition of 0.5 μm GST fusion proteins increases the YOYO-1 fluorescent signal, which corresponds to a more open DNA conformation. We observed more fluorescence with addition of GST-p53 than GST-only, as expected. Furthermore, addition of the mutant Htt protein GST-HD53Q induces more fluorescence than the wild-type GST-HD20Q. Quenching of the fluorescence by poly-l-lysine, a DNA condensing agent, confirms the assay. Data shown in C are a representative experiment from four independent trials. Error bars indicate SEM.
Figure 8.
Figure 8.
Schematic of wild-type (WT) and mutant Htt mediated effects on genomic DNA. Nuclear-localized mutant Htt facilitates direct Htt–DNA binding, which in turn leads to altered DNA conformation and altered transcription factor (TF) binding, ultimately resulting in gene expression dysregulation. Altered DNA conformation could be reflected in chromatin structure alterations, as suggested by histone modification profiles (Sadri-Vakili et al., 2007).

References

    1. Anderson AN, Roncaroli F, Hodges A, Deprez M, Turkheimer FE. Chromosomal profiles of gene expression in Huntington's disease. Brain. 2008;131:381–388. - PubMed
    1. Bates GP, Harper PS, Jones AL. In: Huntington's Disease. Ed 3. Bates GP, Harper PS, Jones AL, editors. Oxford: Oxford UP; 2002.
    1. Benn CL, Landles C, Li H, Strand AD, Woodman B, Sathasivam K, Li SH, Ghazi-Noori S, Hockly E, Faruque SM, Cha JH, Sharpe PT, Olson JM, Li XJ, Bates GP. Contribution of nuclear and extranuclear polyQ to neurological phenotypes in mouse models of Huntington's disease. Hum Mol Genet. 2005;14:3065–3078. - PubMed
    1. Boyer LA, Plath K, Zeitlinger J, Brambrink T, Medeiros LA, Lee TI, Levine SS, Wernig M, Tajonar A, Ray MK, Bell GW, Otte AP, Vidal M, Gifford DK, Young RA, Jaenisch R. Polycomb complexes repress developmental regulators in murine embryonic stem cells. Nature. 2006;441:349–353. - PubMed
    1. Callewaert L, Christiaens V, Haelens A, Verrijdt G, Verhoeven G, Claessens F. Implications of a polyglutamine tract in the function of the human androgen receptor. Biochem Biophys Res Commun. 2003;306:46–52. - PubMed

Publication types

MeSH terms

LinkOut - more resources