Review
. 2008 Oct;88(4):1277-340.
doi: 10.1152/physrev.00027.2007.

Diffusion in brain extracellular space

Affiliations
Review

Diffusion in brain extracellular space

Eva Syková et al. Physiol Rev. 2008 Oct.

Abstract

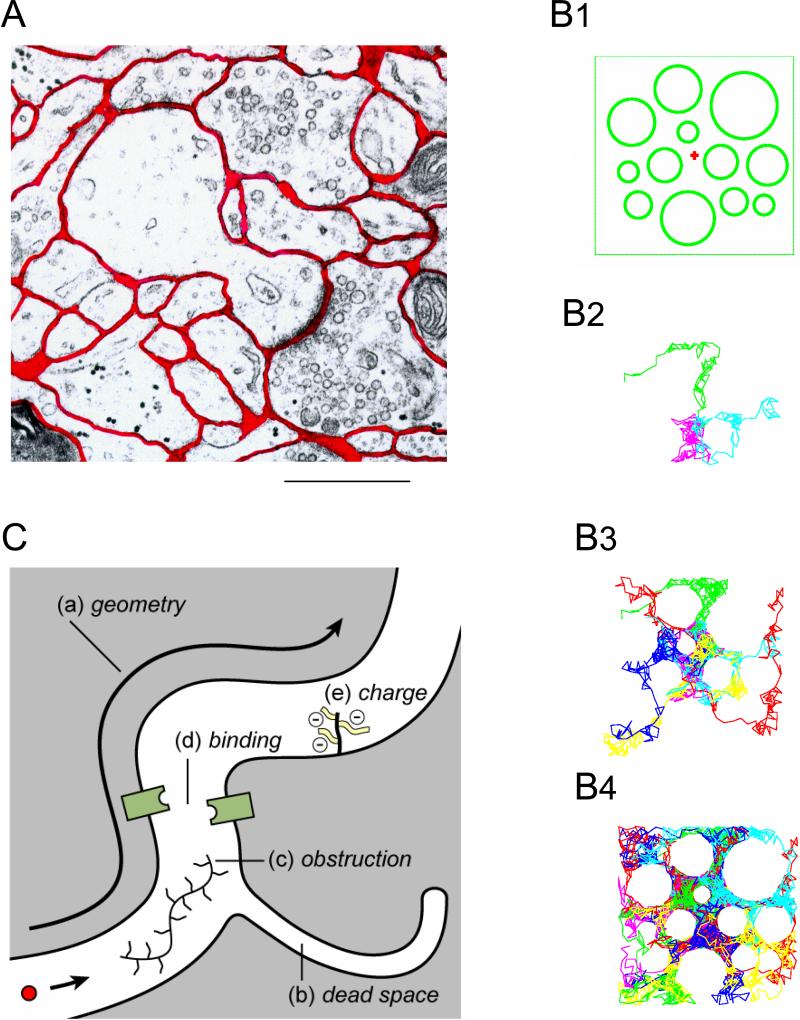
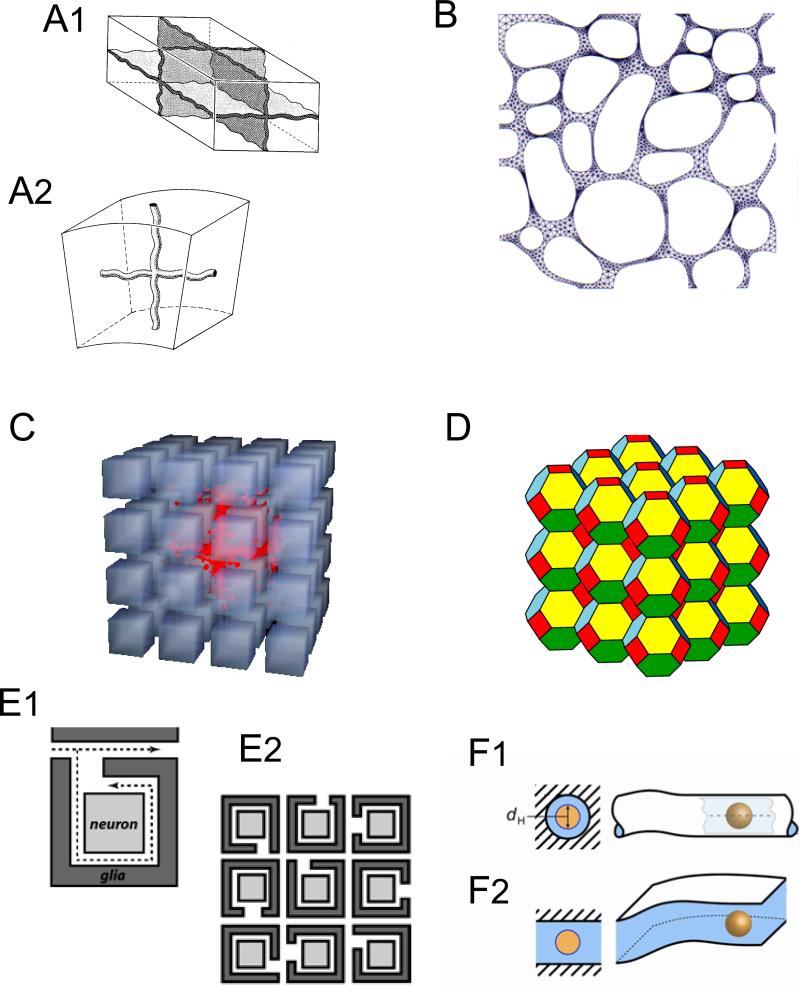
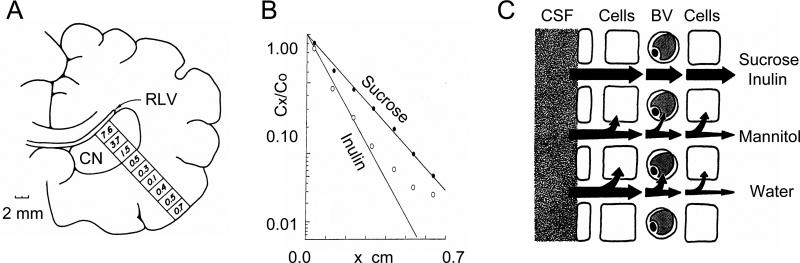
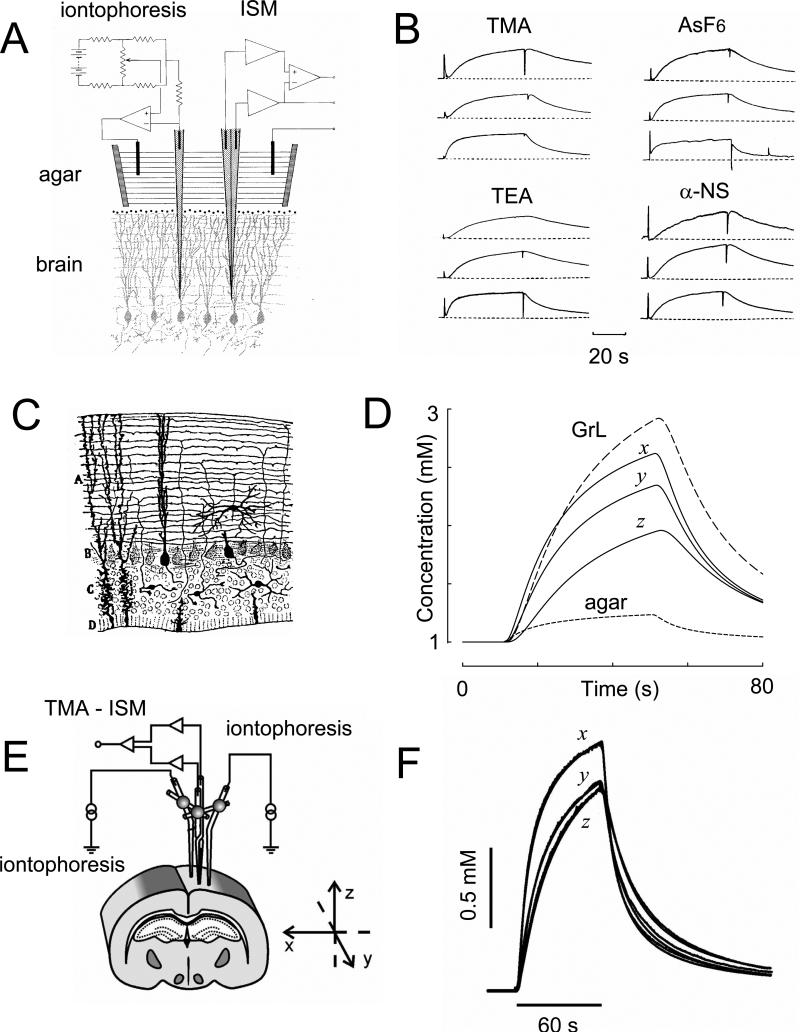
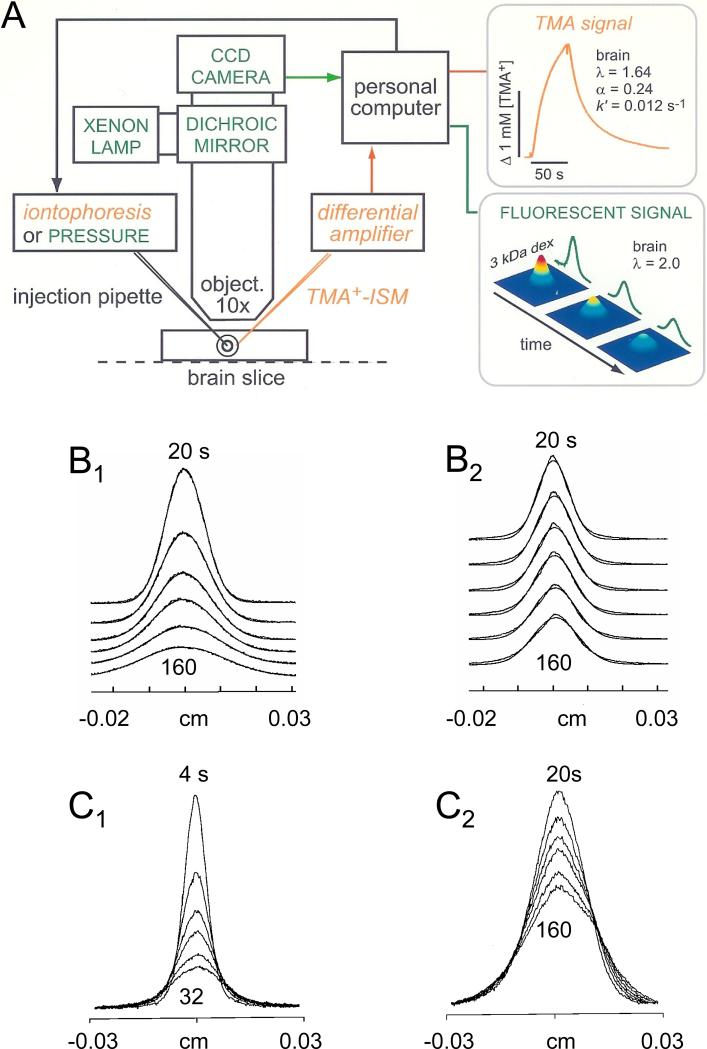
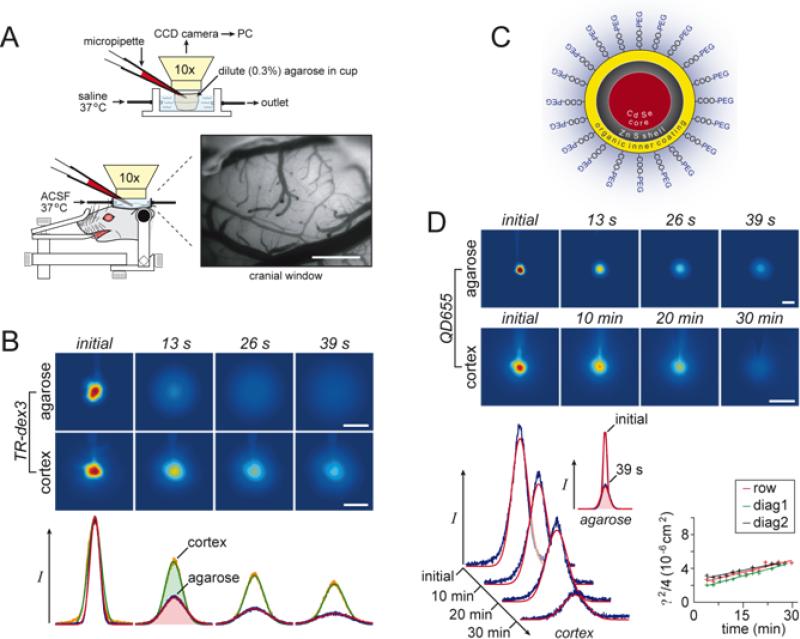
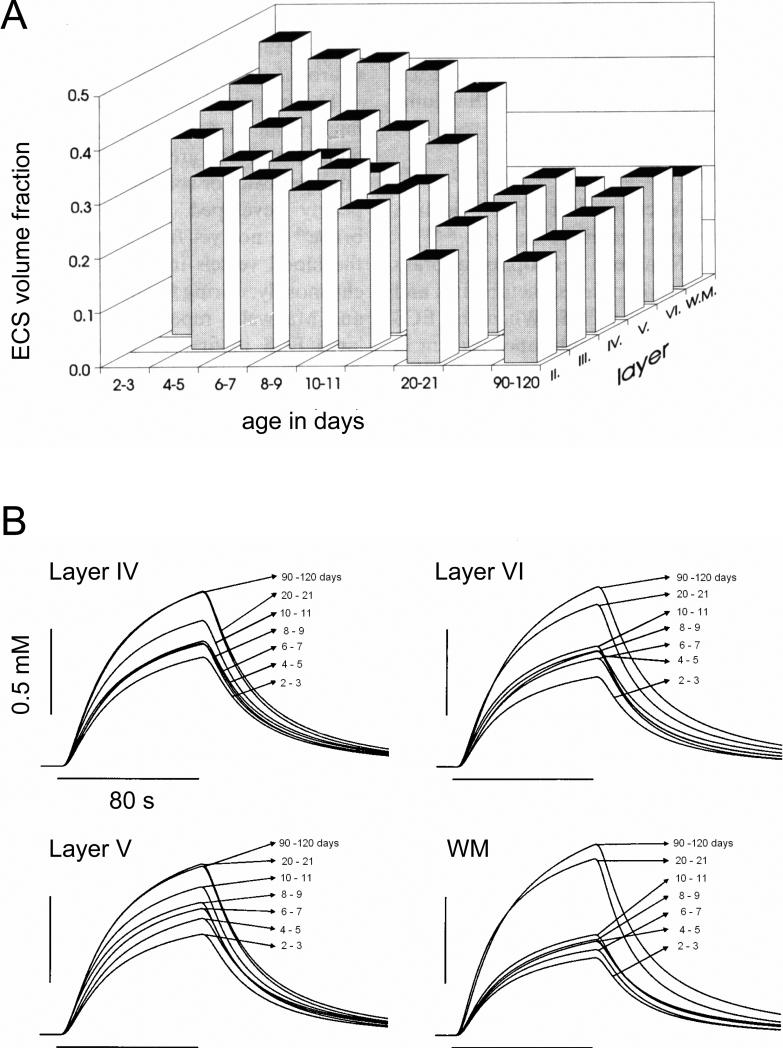
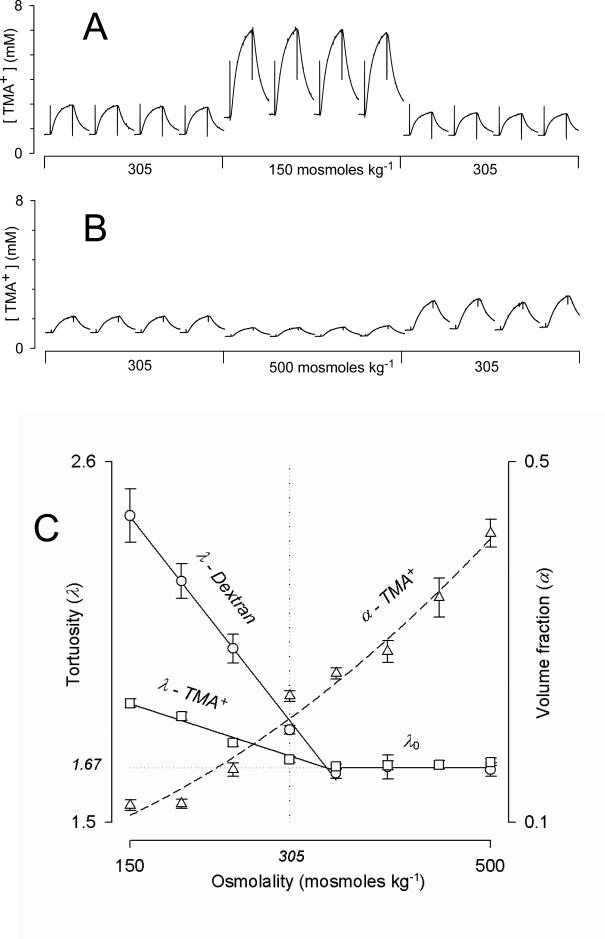
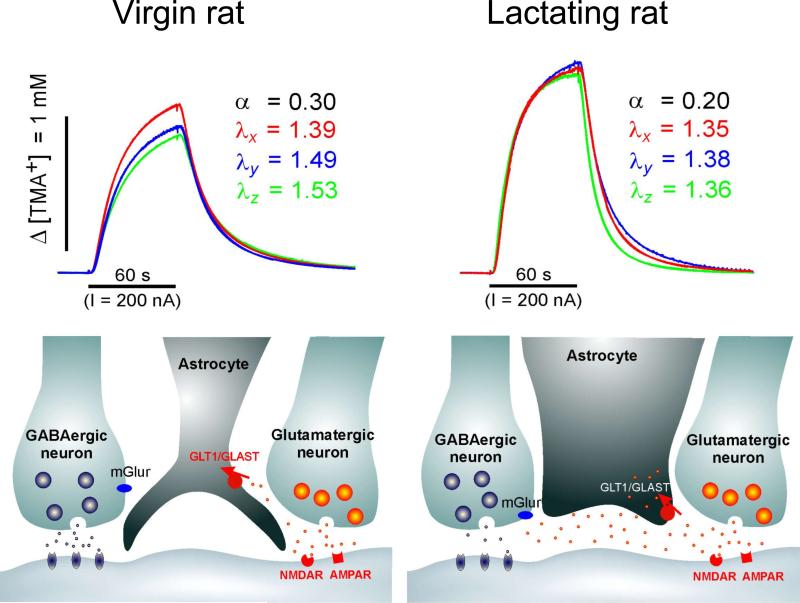
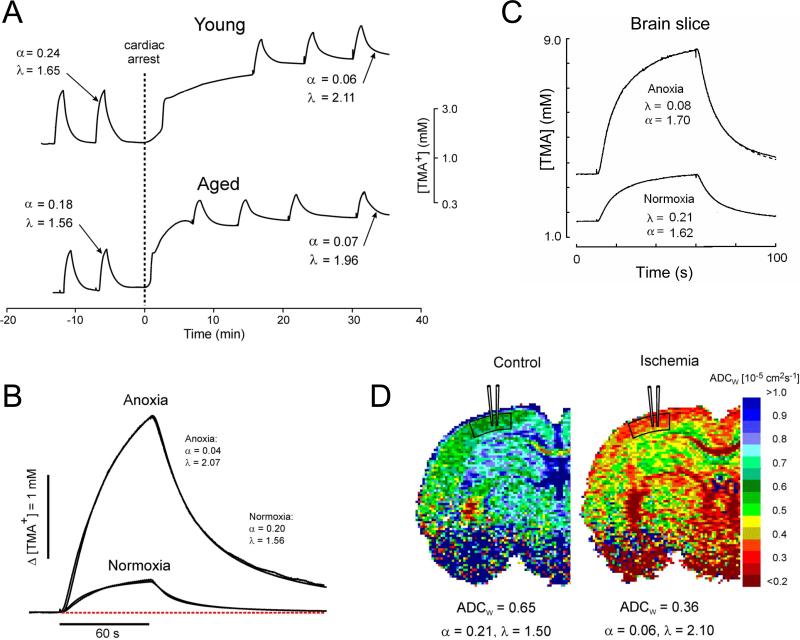
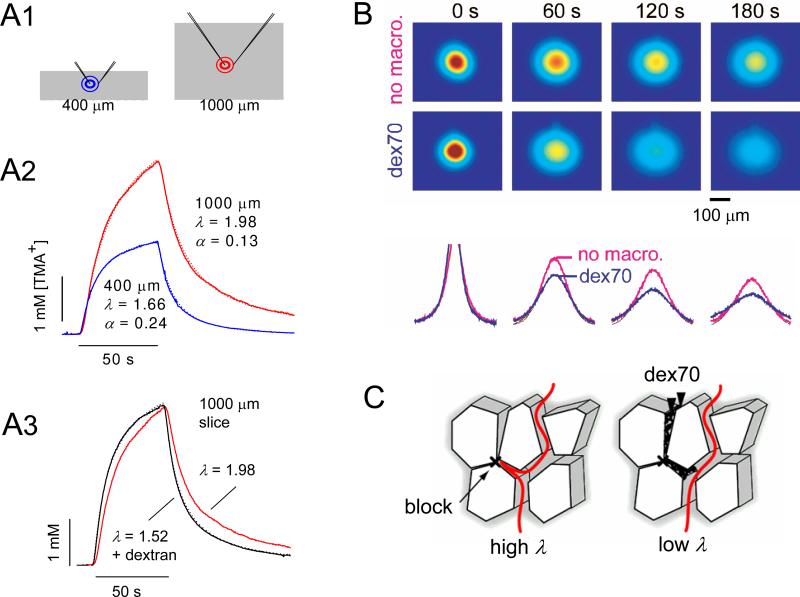
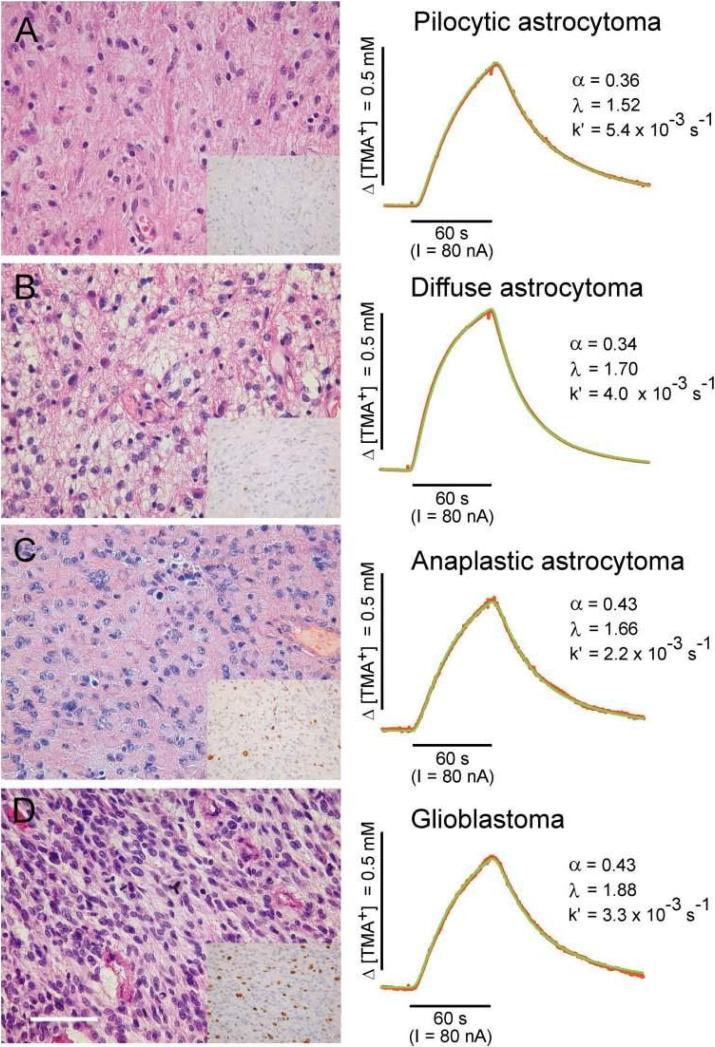
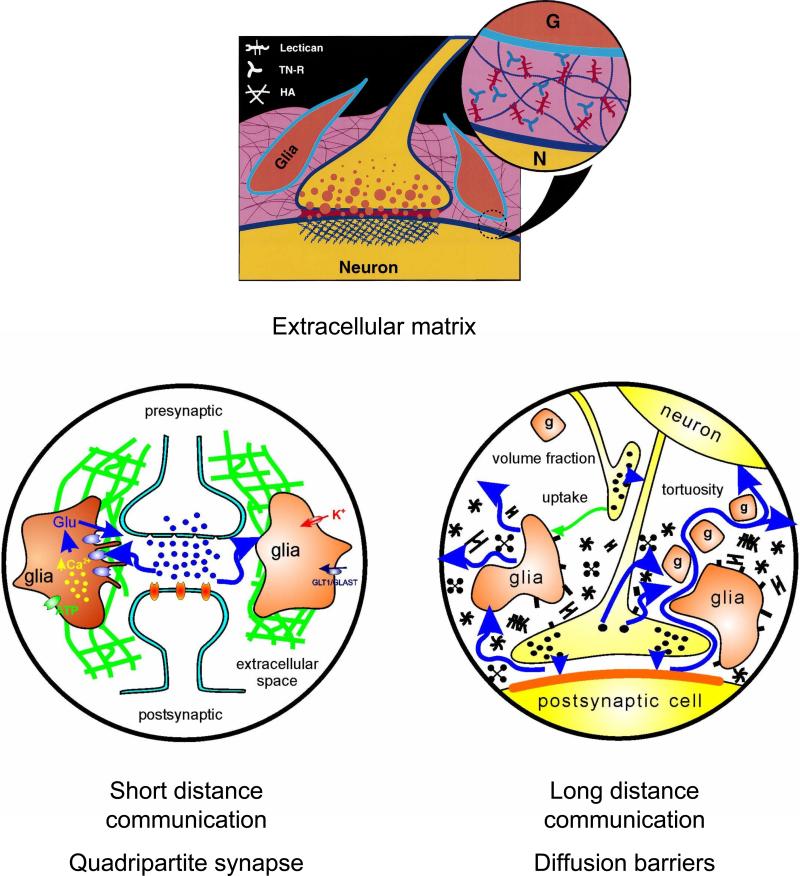
Diffusion in the extracellular space (ECS) of the brain is constrained by the volume fraction and the tortuosity and a modified diffusion equation represents the transport behavior of many molecules in the brain. Deviations from the equation reveal loss of molecules across the blood-brain barrier, through cellular uptake, binding, or other mechanisms. Early diffusion measurements used radiolabeled sucrose and other tracers. Presently, the real-time iontophoresis (RTI) method is employed for small ions and the integrative optical imaging (IOI) method for fluorescent macromolecules, including dextrans or proteins. Theoretical models and simulations of the ECS have explored the influence of ECS geometry, effects of dead-space microdomains, extracellular matrix, and interaction of macromolecules with ECS channels. Extensive experimental studies with the RTI method employing the cation tetramethylammonium (TMA) in normal brain tissue show that the volume fraction of the ECS typically is approximately 20% and the tortuosity is approximately 1.6 (i.e., free diffusion coefficient of TMA is reduced by 2.6), although there are regional variations. These parameters change during development and aging. Diffusion properties have been characterized in several interventions, including brain stimulation, osmotic challenge, and knockout of extracellular matrix components. Measurements have also been made during ischemia, in models of Alzheimer's and Parkinson's diseases, and in human gliomas. Overall, these studies improve our conception of ECS structure and the roles of glia and extracellular matrix in modulating the ECS microenvironment. Knowledge of ECS diffusion properties is valuable in contexts ranging from understanding extrasynaptic volume transmission to the development of paradigms for drug delivery to the brain.


Figures

Fig. 1
Fig. 1
Basic concepts of ECS. A. Electronmicrograph of small region of rat cortex with dendritic spine and synapse. The ECS is outlined in red; it has a well-connected foam-like structure formed from the interstices of simple convex cell surfaces. Even though the ECS is probably reduced in width due to fixation procedure it is still evident that it is not completely uniform in width. Calibration bar approximately 1 μm. (Modified from Ref. 264). B1-B4. Molecules executing Random walks reveal structure. B1: cross-section through an idealized 2D square brain region bounded by impermeable walls and containing a number of circular cellular profiles. The ECS width is exaggerated. B2: Three molecules (different colors) have been released from the location marked with a red “+” in B1 and allowed to execute up to 150 random steps. If the molecules encounter a cell boundary or wall, the step is canceled and the next random step selected. The profiles of the cells are omitted from this and the two subsequent panels, only the trajectories of the random walks are shown. The three trajectories in B2 appear to have a random distribution. B3: 12 molecules execute random walks and now the aggregate of their trajectories begins to reveal the presence of the cells. B4: 48 random walks reveal an increasingly accurate view of the boundaries of the cells and the boundaries of the region. Note that the individual steps are large in this simulation to reduce the number required to reveal the geometry (Modified from Ref. 264). C. Factors affecting the diffusion of a molecule in the ECS. These are: a) geometry of ECS which imposes an additional delay on a diffusing molecule compared to a free medium. b) dead-space microdomain where molecules lose time exploring a dead-end. Such a microdomain may be in the form of a ‘pocket’ as shown but it may also take the form of glial wrapping or even a local enlargement of the ECS. c) Obstruction in the form of extracellular matrix molecules such as hyaluronan. d) binding sites for the diffusing molecule either on cell membranes or extracellular matrix. e) fixed negative charges, also on the extracellular matrix, that may affect the diffusion of charged molecules.
Fig. 2
Fig. 2
Theoretical models of ECS. A1-A2. ‘Unit cells’. Replication and stacking these elementary objects builds a simple ECS (stippled regions). A1 shows intersection of eight cubical cells at center A2 shows a system of 2D tubular channels between cells. (Modified from Ref. 218). B. ECS constructed as an asymmetric mesh in 2D for finite element method of computer solution for diffusion (Modified from Ref. 61). C. Monte Carlo simulation in ensemble of 3D cubic cells packing with small separation forming an ECS. A set of molecules (red) has been released at the center of the ensemble and are performing random walks causing the cloud of molecules to spread outwards and explore the local environment. (Hrabe and Hrabětová, unpublished). D. Ensemble of truncated octahedral cells. These also pack to fill 3D space but unlike ensembles of cubes have no aligned channels through the array of cells. (Modified from Ref. 380). E1-E2. Hypothetical wrapping of glial cells around neurons to form a dead-space microdomain. E1 shows a single neuron-glial combination, dotted lines indicate two paths that a molecule might take. The path within the glial wrapping is obviously longer and will delay the diffusing molecule more than the path that avoids entering the wrapping. E2 shows an ensemble of wrapped neurons. (Hrabětová, unpublished). F1-F2. Pore models of the ECS for analyzing diffusion of large molecules. F1. A tubular pore where the molecule (yellow) with hydrodynamic diameter dH takes up an appreciable amount of the pore leaving a small amount of ECS (blue) around the molecule. Here the total ECS is envisaged as a connecting set of tubes (c.f. panel A2) possible formed within the extracellular matrix. F2. Planar or sheet-like pores. Here the molecule has more lateral freedom to move (c.f. panel A1). (Modified from Ref. 391).
Fig. 3
Fig. 3
Radiotracer method. A. Tracer is perfused through the right lateral ventricle (RLV) and diffuses into the brain for 3-5 hours then the brain is fixed and removed. Small blocks of brain are cut as indicated and assayed for radioactivity. The number indicates percent of radiolabeled inulin or sucrose in a given tissue block. The caudate nucleus (CN) is immediately adjacent to the RLV so this structure has been most thoroughly analyzed. The scale bar of 2 mm is appropriate to a dog brain. (Modified from Ref. 303). B. Concentration of C14-sucrose and H3-inulin after four hours of ventriculocisternal perfusion in dog brain. Ordinate is plotted on complementary error function (erfc) scale (see Equation 12), Cx is concentration at distance x (abscissa) from ventricular border of caudate nucleus where concentration is C0 (Modified from Ref. 104). C. Schematic of several possible pathways a molecule can follow after entering the brain tissue from the ventricular CSF. Arrows indicate the pathways; the thickness of the arrow represents the relative importance of that pathway. Sucrose and inulin remain predominantly extracellular, mannitol enters cells to some extent and a small amount crosses the BBB, water readily enters cells and crosses BBB. (Modified from Ref. 104).
Fig. 4
Fig. 4
The RTI method. A. Original setup. Paired iontophoretic and ion-selective microelectrodes (ISM) are glued together and lowered into rat cerebellum in vivo. The iontophoretic microelectrode passes a current pulse controlled by a constant current circuit. The signals from the ion-sensing and reference barrels of the ISM are impedance-buffered and subtracted to remove contribution of local potential in brain. This results in an output that is proportional to the logarithm of the local ion concentration. Electrode array is withdrawn into agar for control measurements. (Modified from Ref. 257). B. Examples of RTI records using four different ions. All records taken in rat cerebellum in vivo. Each record in each set was taken at a different spacing between source electrode and ISM. Ordinate is concentration, abscissa is time. See original paper for details. (Modified from Ref. 257). C. Part of a frontal section through the cerebellum of a lizard. This cerebellum is very similar to that of the turtle. A, Molecular layer; B, Purkinje cells; C, granular layer; D, ependyma (Modified from Ref. 56). D. Diffusion anisotropy demonstrated by theoretical concentration-time profiles derived from average diffusion parameters measured in the turtle cerebellum and control medium. Theoretical records illustrate the relative concentration reached during the iontophoresis of TMA+ in the x-, y- and z-axes of the molecular layer, the granular layer (GrL) and agar gel. Diffusion distance used to calculate the curves was 120 μm. The tortuosity values were: molecular layer, λx = 1.44, λy = 1.95, λz = 1.58, α = 0.31 and granular layer, λ = 1.77, α = 0.22. (Modified from Ref. 314). E. Setup used to measure anisotropy in rat corpus callosum in vivo with the RTI-TMA method. The design is similar to that shown in panel A except that two iontophoresis microelectrodes are used to allow simultaneous measurements in the x- and y- or x- and z-axes (Modified from Ref. 410). F. Example of measurements in rat corpus callosum with the RTI-TMA method. In this record, λx = 1.44, λy = 1.70, λz = 1.72, α = 0.24. Ordinate is TMA+ concentration, abscissa is time. (Modified from Ref. 358).
Fig. 5
Fig. 5
A. Setup for integrative optical imaging (IOI) method and RTI-TMA in brain slices. A brain slice or dilute agarose (or agar) gel is placed into a chamber on a stage of a compound microscope equipped with epifluorescent optics. For IOI, a fluorescent molecule is pressure injected from a micropipette and a time series of images captured using a charge-couple device (CCD) camera. The images are processed with a PC to fit Equation 20 to the intensity profiles measured along selected image axes. Diffusion coefficients, D and D*, are extracted in agarose gel and brain slice, respectively. As shown in this figure, RTI-TMA measurements can also be made in this setup with the advantage that the iontophoresis microelectrode and the ISM can be positioned independently under visual control. Both IOI and RTI measurements can be performed simultaneously. (Modified from Ref. 149). B1-B2. Diffusion profiles for 70 kDa fluorescent dextran. B1. Profiles measured at 20, 40, 60, 80, 120 and 160 s after pressure injection in agarose gel as a function of distance in object space (slice). Profiles have characteristic shape of a Gaussian curve. B2. Similar profiles measured in slices of rat cortex. Note that the profiles collapse much more slowly in brain than in agarose as a consequence of the tortuosity in the slice (λ = 2.25 for 70 kDa dextran). (Modified from Ref. 265). C1-C2. Diffusion profiles for 66 kDa fluorescent bovine serum albumin (BSA). C1. Profiles measured at 4, 8, 12, 16, 24 and 32 s after pressure injection in agarose gel as a function of distance in object space (slice). C2. Similar profiles measured in slices of rat cortex. Profiles measured at 20, 40, 60, 80, 120 and 160 s after pressure injection; again the profiles collapse much more slowly in brain than in agarose (λ = 2.26 for 66 kDa BSA). (Modified from Ref. 379).
Fig. 6
Fig. 6
IOI measurements in vivo using 3 kDa dextran and quantum dots. A. Experimental setup for IOI diffusion measurements in vivo. Successive images of fluorescent probe diffusion were captured by a cooled charge-coupled device (CCD) camera and epifluorescent microscope with a 10× water-immersion objective (cf. Fig. 5A) after pressure ejection from a micropipette into either dilute agarose or somatosensory cortex, accessed through an open cranial window in rat (scale bar – 500 μm). B. Dextran diffusion in neocortex. Representative images after fluorescent dex3 ejection into agarose or cortex. Fluorescence intensity profiles and theoretical fits for the images shown below images, yielding D = 2.3 × 10⁻⁶ cm2 s−1 and D* = 4.5 × 10⁻⁷ cm2 s−1. Scale bars – 200 μm. C. Schematic of quantum dot (QD655, Invitrogen). Inner core cadmium and selenium provides characteristic fluorescence. The core is stabilized with a zinc shell which in turn has an organic coating to which are attached numerous PEG molecules to render the quantum dot water soluble. The final diameter of QD655 is 35 nm. D. Quantum dot diffusion in neocortex. Representative images after QD655 ejection into agarose or cortex. Scale bars – 100 μm. Fluorescence intensity profiles and theoretical fits shown below the images, yielding D = 1.9 × 10⁻⁷ cm2s−1 and D* = 1.6 × 10⁻⁹ cm2s−1. Linear regression of cortex data in inset (see Equation 20); γi2=4D(ti+t0), so regression of γi24 upon ti returns a slope of D*. (Panels A, B and D modified from Ref. 391).
Fig. 7
Fig. 7
Changes in diffusion parameters during development. A. Three-dimensional bar chart depicting the distribution of volume fraction as a function of age in postnatal days and cortical layer. Layers II and III were too small to make measurements at some early ages. B. Comparison of theoretical diffusion curves for layers IV, V, VI of the cortex and for the subcortical white matter (WM) at different postnatal days. Each curve was computed using Equation 13 and Equation 15 and the mean values for diffusion parameters α, λ, k′ given in Lehmenkühler et al. (193) (also summarized in Table 4A, 4B). To compute the curves a spacing between iontophoresis microelectrode and ISM of r = 175 μm, a value of D = 1.26 × 10⁻⁵ cm2 s−1 and nt = 0.5 were used. Note that the curves with lowest amplitude occur at the earliest age caused primarily by the large volume fraction at that time. (Panels A and B modified from Ref. 193).
Fig. 8
Fig. 8
Effects of osmotic challenges on diffusion curves in rat cortical slices. A. Challenge with 150 mosmole kg−1 ACSF. Sequence of four control diffusion records in 305 mosmole kg−1 medium followed by four in 150 mosmole kg−1 medium and finally four more records after return to 305 mosmole kg−1 medium. The interval between records was longer than that illustrated to permit baseline concentration to stabilize. For all records in Panel A, r = 106 μm, nt = 0.44. Average results for initial four control records were, λ = 1.67, α = 0.27; for the curves in hypotonic medium, λ = 1.80, α = 0.10; for the four records on return to control medium, λ = 1.57, α = 0.34. B. Effect of challenge with 500 mosmole kg−1 ACSF. The experiment was similar to that illustrated in Panel A, except that hypertonic medium 500 mosmole kg−1 medium was used. For all records in Panel B, r = 132 μm, nt = 0.29. Average results for initial four control records were, λ = 1.77, α = 0.20; for the four curves in hypertonic medium, λ = 1.72, α = 0.37; the four records on return to control medium, λ = 1.88, α = 0.13. C. Comparison of behavior of λ measured with RTI-TMA method and 3 kDa dextran measured with IOI with behavior of α (measured with RTI-TMA). Dextran data calculated from Ref.. Tortuosity measured with both molecules increases linearly as osmolality decreases below control value (305 mosmoles kg−1), but the slope measured with the larger molecule (dextran) is greater than that measured with the smaller (TMA+). In hypertonic ACSF, the value of λ measured with both molecules quickly reaches a constant value, λ0 = 1.67. In contrast, α varies smoothly and monotonically with osmolality, decreasing in hypotonic ACSF and increasing in hypertonic medium. (All panels modified from Ref. 183).
Fig. 9
Fig. 9
Retraction of glial processes in rat supraoptic nucleus (SON) and consequences for diffusion and synaptic crosstalk. Upper row: Examples of diffusion curves in virgin and lactating rats. SON is anisotropic so three values of λ together with one value of α extracted from these curves are indicated on the figure. Lower row: The values shown in the upper row and electron micrographic evidence (383) indicate that reduced astrocytic coverage of SON neurons in lactating rats leads to deficient glutamate clearance, resulting in increased glutamate concentration in the ECS, increased crosstalk between synapses and increased activation of either presynaptic or postsynaptic receptors. (Adapted from Refs. 292, 359).
Fig. 10
Fig. 10
Effects of anoxia and ischemia on cortical diffusion parameters in vivo and in brain slices. A. Sequences of RTI-TMA measurements in the young adult and an aged (28-months) rats after cardiac arrest. Diffusion curves were recorded in cortical layer V before and after cardiac arrest and are superimposed on the increasing TMA+ baseline caused by ECS volume shrinkage. Diffusion parameters indicated on the figure (Modified from Ref. 363). B. detailed curves from rat cortex in vivo during anoxia showing the large changes in diffusion curves compared to normoxia caused by the drastic reduction in α and a more modest but still significant increase in λ (Syková et al., unpublished). C. Cortical slice before and after exposure to hypoxic medium and gas. Note that the changes are not as large as those encountered in vivo. (Modified from Ref. 290). D. DW-MRI measurements in control rat cortex and ischemic cortex. Measurements were also made with RTI-TMA and the parameters are indicated below the DW-MRI images (Syková et al., unpublished).
Fig. 11
Fig. 11
Combined use of RTI-TMA and IOI methods to investigate dead-space microdomains. A1-A3. RTI-TMA studies. A1. Schematic of independent iontophoresis microelectrode and ISM placement in a normal 400 μm slice and a 1000 μm ‘thick’ slice. The thick slice represents a model of ischemic tissue. A2. TMA+ diffusion curves in brain slices. TMA+ pulse applied for 50 s (horizontal bar) and detected by a TMA+-ISM 100 μm away. Diffusion curves are superimposed with theoretical curve (Equations 13 and 15). Representative recordings from 400 (blue curve) and 1000 μm neocortical ‘thick’ slices (red curve). As expected, the tortuosity is higher and volume fraction is lower in the ischemic slice. A3. Representative recording from 1000 μm slice incubated with 70 kDa dextran in the bath (black curve); this brings about a paradoxical fall in tortuosity. For comparison, the diffusion curve from 1000 μm slices incubated without dextran (red curve) shown in A2 is superimposed (Modified from Ref. 148). B. Use of IOI to study effect of added background molecules (70 kDa dextran without fluorescent label) on diffusion of 3 kDa dextran fluorescent molecules (fdex3). Top image row: Images of fdex3 taken immediately after the pressure injection (labeled as 0 s) and at 60, 120, and 180 s later in neocortical thick slices. The intensity shown in pseudo color (red highest, blue lowest) represents the concentration of the fdex3 in the tissue. The images in the upper row were taken in the absence of background macromolecules (no macro.). The images in the lower row were in the presence of non-fluorescent dex70. The intensity profiles of data (bottom), obtained along the horizontal line running through the center of the image. In the presence of dex70, the image intensity dissipated faster and therefore the collapse of the curve (blue) is more pronounced. Tortuosities were 3.66 and 2.37 in the absence and presence of dex70, respectively. (Modified from Ref. 147). C. It is hypothesized that during ischemia and other pathological conditions, cellular elements expand their volume as water moves from the extracellular to the cellular compartment and blockages are formed in some interstitial planes. Diffusing molecules that enter these pocket-like regions are delayed and tortuosity increases (left schematic). When background macromolecules, such as dex70, are added to this tissue, they become trapped in the dead-spaces. By excluding the dead-space volume, dex70 prevents marker molecules from being delayed there and tortuosity decreases (right schematic). (Modified from Ref. 147).
Fig. 12
Fig. 12
Left: Hematoxylin and eosin staining of the studied brain tumor tissues and the corresponding immunolabeling shown in insets (see Ref. for details). Right: Representative TMA-diffusion curves recorded in each distinct type of tumor with the corresponding values of the ECS diffusion parameters α and λ. A: Pilocytic astrocytoma (WHO grade I). B: Diffuse fibrillary astrocytoma (WHO grade II). C: Anaplastic astrocytoma (WHO grade III). D: Glioblastoma (WHO grade IV). Scale bar = 50μm applies to each photomicrograph. (Modified from Ref. 402).
Fig. 13
Fig. 13
Extracellular microenvironment and volume transmission. Upper panel. Synapses and the entire ECS are embedded in an extracellular matrix of unknown density. The extracellular matrix has several components, including lecticans, tenascin-R (TN-R), as well as tenascin-C in the developing brain, and hyaluronan (HA). G, glia; N, neuron. (Modified from Ref. 421). Lower panels. Extracellular communication. Short distance communication. This occurs via closed synapses that are typical of synaptic transmission. These synapses are often ensheathed by glial processes and by the extracellular matrix, forming perineuronal or perisynaptic nets. The ECS changes its diffusion parameters in response to neuronal activity and glial cell re-arrangement. In short-distance communication by diffusion, presynaptic terminals, postsynaptic terminals, glial cell processes and the ECS form a ‘plastic’ quadripartite synapse. Long-distance communication. The CNS architecture is composed of neurons, axons, glia, cellular processes, molecules of the extracellular matrix and intercellular channels between the cells. This architecture slows down the movement (diffusion) of substances in the brain, which is critically dependent on the ECS diffusion parameters volume fraction (α), tortuosity (λ) and in some situations, loss or uptake (k′). (Modified from Ref. 358).

References

    1. Abbott NJ. Evidence for bulk flow of brain interstitial fluid: significance for physiology and pathology. Neurochem Int. 2004;45:545–552. - PubMed
    1. Abbott NJ, Ronnback L, Hansson E. Astrocyte-endothelial interactions at the blood-brain barrier. Nat Rev Neurosci. 2006;7:41–53. - PubMed
    1. Adrian RH, Chandler WK, Hodgkin AL. The kinetics of mechanical activation in frog muscle. J. Physiol. 1969;204:207–230. - PMC - PubMed
    1. Agnati LF, Fuxe K, Nicholson C, Syková E. Volume Transmission Revisited. Elsevier; Amsterdam: 2000.
    1. Agnati LF, Leo G, Zanardi A, Genedani S, Rivera A, Fuxe K, Guidolin D. Volume transmission and wiring transmission from cellular to molecular networks: history and perspectives. Acta Physiol (Oxf) 2006;187:329–344. - PubMed

Publication types

Substances

LinkOut - more resources