. 2008;3(10):e3412.
doi: 10.1371/journal.pone.0003412. Epub 2008 Oct 15.

Rare codons cluster

Affiliations

Rare codons cluster

Thomas F Clarke 4th et al. PLoS One. 2008.

Abstract

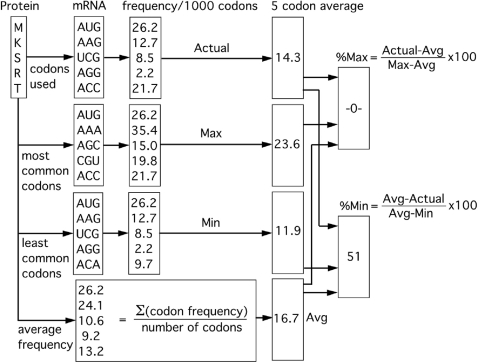
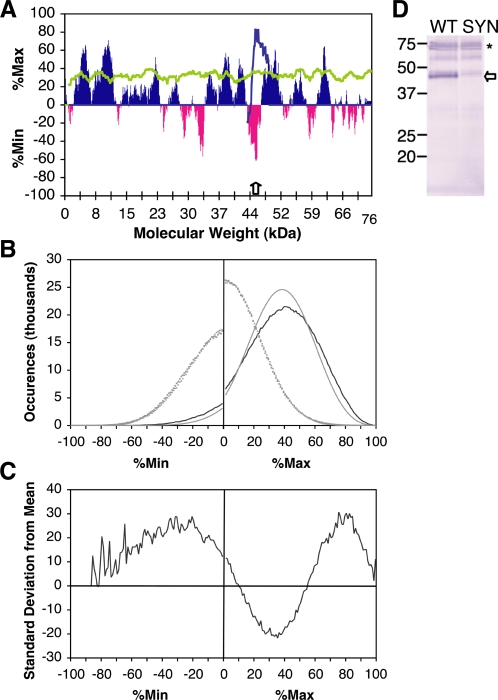
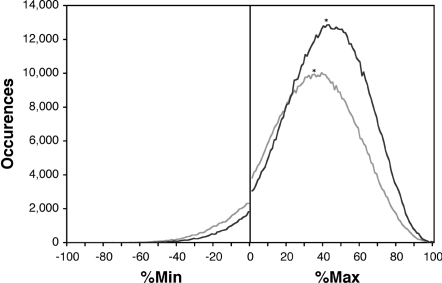
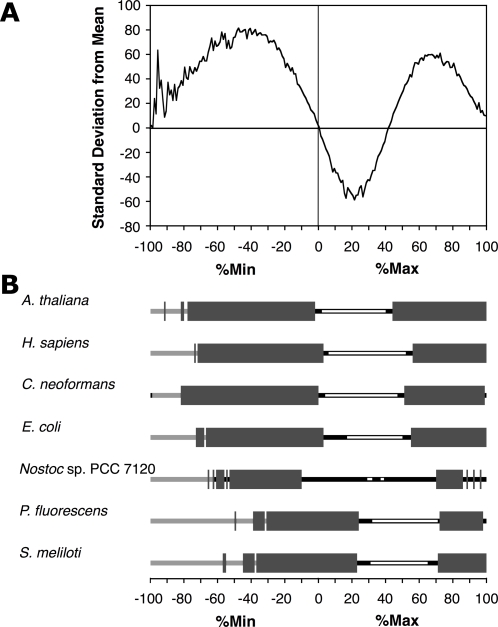
Most amino acids are encoded by more than one codon. These synonymous codons are not used with equal frequency: in every organism, some codons are used more commonly, while others are more rare. Though the encoded protein sequence is identical, selective pressures favor more common codons for enhanced translation speed and fidelity. However, rare codons persist, presumably due to neutral drift. Here, we determine whether other, unknown factors, beyond neutral drift, affect the selection and/or distribution of rare codons. We have developed a novel algorithm that evaluates the relative rareness of a nucleotide sequence used to produce a given protein sequence. We show that rare codons, rather than being randomly scattered across genes, often occur in large clusters. These clusters occur in numerous eukaryotic and prokaryotic genomes, and are not confined to unusual or rarely expressed genes: many highly expressed genes, including genes for ribosomal proteins, contain rare codon clusters. A rare codon cluster can impede ribosome translation of the rare codon sequence. These results indicate additional selective pressures govern the use of synonymous codons, and specifically that local pauses in translation can be beneficial for protein biogenesis.


Conflict of interest statement

Competing Interests: The authors have declared that no competing interests exist.

Figures

Figure 1
Figure 1. %MinMax analysis for the pentapeptide MKSRT, encoded by AUGAAGUCGAGGACC (total number of codons per amino acid: M, 1; K, 2; S, 6; R, 6; T, 4).
For each codon, three E. coli absolute codon frequencies are tabulated using codon usage data from KazUSA : (i) the frequency with which this codon is used in the entire E. coli genome (Actual), (ii) the usage frequency for the most common codon encoding this amino acid (Max), and (iii) the usage frequency for the least common codon encoding this amino acid (Min). An average usage frequency (Avg) is also calculated for each residue by summing the individual codon frequencies and dividing by the number of codons (for each residue). The resulting values are typically averaged over an 18-codon window (a window of 5 is used here); window sizes from 5 to 30 codons produced similar distributions of rare codon clusters, though the noise was increased with smaller window sizes. These four codon usage frequencies are used to calculate %Max and %Min using the equations shown; note that only positive values are reported (i.e., each window may yield a value for either %Min or %Max, not both). A %Min value of 51 means that this sequence is approximately halfway between the maximum rare sequence and the average sequence, and is plotted as −51.
Figure 2
Figure 2. Codon clustering in bacterially expressed genes.
(A) %MinMax was applied to the P22 tailspike gene, using a sliding window size of 18 codons and the E. coli codon bias (essentially identical to the codon bias of S. enterica serovar Typhimurium, the endogenous host of P22). Dark %Max bars correspond to clusters of common codons; lighter %Min (negative) bars correspond to clusters of rare codons. In contrast, the average of 200 random reverse translations of tailspike, biased to E. coli codon usage frequencies, yields a %MinMax profile that is entirely %Max (grey line). The white arrow marks the location of the deepest %Min peak, at codon 406. Silent mutagenesis of P22 tailspike to replace this rare codon cluster with synonymous common codons alters the %MinMax plot (black line); these mutations only affect the indicated %Min peak. (B) The %MinMax value for every window of the entire E. coli ORFeome was calculated using a sliding window of 18 codons and used to construct a histogram of %MinMax values at intervals of 1%MinMax. Negative bin numbers represent %Min values. The effects of codon clustering are seen when the E. coli ORFeome (black line) is compared to the +1 and −1 out-of-frame sequences of the E. coli genome (dotted lines) or the average of 200 codon-biased random reverse translations analyzed using the same statistical conditions as the entire ORFeome (grey line). (C) The deviation of the distribution of %MinMax bins throughout the E. coli ORFeome from the average of 200 codon-biased random reverse translations of the entire ORFeome is greatest in high %Max regions (30 standard deviations from mean), and at −31%Min (28 standard deviations from mean). (D) Tailspike was expressed in vivo on E. coli ribosomes. After lysis, the N-terminal His-tag of tailspike was detected using an anti-His tag antibody, revealing two major bands: full length tailspike (asterisk), which dwells on the ribosome post-translationally , and a 49 kDa band corresponding to the size of a nascent chain produced during pausing at approximately codon 406, the location of the deepest %Min peak (white arrow). Silent mutagenesis to eliminate the large rare codon cluster centered at codon 406 (SYN) eliminates the 49 kDa band.
Figure 3
Figure 3. Codon clustering within subsets of the E. coli ORFeome, separated by gene classification.
2166 characterized genes from the E. coli ORFeome (dark line) are enriched in common codons as compared to 2325 genes annotated as unclassified, hypothetical, or unknown function (grey line). The median of each curve is denoted with an asterisk. %MinMax values were calculated using the codon usage frequencies from the entire ORFeome, with a sliding window of 18 codons.
Figure 4
Figure 4. Codons cluster in a wide variety of organisms.
(A) The %MinMax distribution for every gene of the Arabidopsis thaliana genome annotation database was calculated using a window size of 18 codons and compared to 200 random reverse translations as described for Figure 2B. A. thaliana shares a similar enrichment of rare codon clusters and very common codon clusters as seen for the E. coli ORFeome (Figure 2B). (B) A wide variety of organisms are enriched for rare and very common codon clusters. Regions of enrichment (≥8σ from the mean, thick grey bars) were observed for the ORFeomes of eukaryotes A. thaliana, H. sapiens, and C. neoformans, as well as prokaryotes E. coli, Nostoc, P. fluorescens and S. meliloti. The low %Max regions, which represent a more random distribution of rare and common codons (less clustering), were typically either significantly under-represented (open bars) or not significantly different from the random reverse translations (black bars). In some extreme regions, the random reverse translations were unable to provide sufficient coverage to ensure a normal distribution of the data (light grey bars); see Methods for more details.

References

    1. Duret L. Evolution of synonymous codon usage in metazoans. Curr Opin Genet Dev. 2002;12:640–649. - PubMed
    1. Grantham R, Gautier C, Gouy M, Mercier R, Pave A. Codon catalog usage and the genome hypothesis. Nucl Acids Res. 1980;8:r49–r62. - PMC - PubMed
    1. Kane JF. Effects of rare codon clusters on high-level expression of heterologous proteins in Escherichia coli. Curr Op Biotechnol. 1995;6:494–500. - PubMed
    1. Medigue C, Rouxel T, Vigier P, Henaut A, Danchin A. Evidence for horizontal gene transfer in Escherichia coli speciation. J Mol Biol. 1991;222:851–856. - PubMed
    1. Smith NG, Eyre-Walker A. Why are translationally sub-optimal synonymous codons used in Escherichia coli? J Mol Evol. 2001;53:225–236. - PubMed

Publication types